
We discuss here several aspects of the emission
in nearby galaxies which are most relevant to their application
in surveys of faint objects.
Kennicutt (1983) calibrated the relationship between the integrated
 luminosity and total SFR (equations 5 and 6) in
disk galaxies, and the spectrophotometry presented in Kennicutt (1992)
can be used to derive a corresponding relation between
luminosity and total SFR (equations 5 and 6) in
disk galaxies, and the spectrophotometry presented in Kennicutt (1992)
can be used to derive a corresponding relation between
 flux and SFR.
Practically, the calibration between SFR and  luminosity can be
trasformed to
luminosity can be
trasformed to  luminosity once a mean values
for the
luminosity once a mean values
for the  and
and
 ratios are known.
From the study of a homogeneous sample of normal galaxies
Kennicutt (1992) found mean value
ratios are known.
From the study of a homogeneous sample of normal galaxies
Kennicutt (1992) found mean value  = 0.3
and
= 0.3
and  = 0.5
resulting in an extinction-corrected calibration
= 0.5
resulting in an extinction-corrected calibration
where L is the observed emission line luminosity in units of
 .
.
One drawback of this relation for applications to distant
galaxies is that they require a photometric measurement of the
 . But absolute line fluxes are difficult to measure
in faint galaxies. However, the strong correlation between
. But absolute line fluxes are difficult to measure
in faint galaxies. However, the strong correlation between
 and
and  EWs (Fig. 8)
suggests that
EWs (Fig. 8)
suggests that  can be used as a quantitative
indicator of the SFR in a distant galaxy, in much the same way that
can be used as a quantitative
indicator of the SFR in a distant galaxy, in much the same way that
 is used in nearby galaxies.
Among galaxies dominated by stellar photoionization (solid points)
the data follow a mean relation EW[OII
is used in nearby galaxies.
Among galaxies dominated by stellar photoionization (solid points)
the data follow a mean relation EW[OII = 0.4
EW(
= 0.4
EW( ), with a rms dispersion of
  %.
%.
Kennicutt (1992) showed that an approximate SFR can be derived if the EW and integrated broadband magnitudes are known.
where the B luminosity is expressed in units of the Sun.
However, Fig. 8 clearly shows that
the  versus
  correlation breaks down for
galaxies with luminous active galactic nuclei. These galaxies fall
indeed into two classes, those with abnormally strong
correlation breaks down for
galaxies with luminous active galactic nuclei. These galaxies fall
indeed into two classes, those with abnormally strong  emission,
independent of Balmer line strength, and those with strong Balmer,
emission,
independent of Balmer line strength, and those with strong Balmer,
 and
and  emission but weak emission in
  .
The former most often are Seyfert 2.
.
The former most often are Seyfert 2.
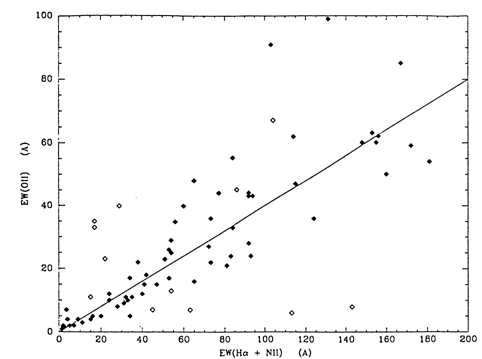
Figure 8: Relation between the equivalent widths of the  and
and  emission lines. Notation the same
as in Fig. 5. The line shows a simple model with
emission lines. Notation the same
as in Fig. 5. The line shows a simple model with
 .
.
Roberto Saglia

