


Next: References:
Up: No Title
Previous: Past and future
In this Praktikum we will analyze high resolution (5-7 Å ) spectra of
the following galaxies:
ngc4889, ngc2275, ngc4750, ngc6181, ngc4449, ngc7714.
The spectra, taken from the Kennicutt et al. (1992) Atlas,
provide a basic set of continuum energy distributions and
emission-line fluxes for a range of galaxy types
as shown in Table 1.
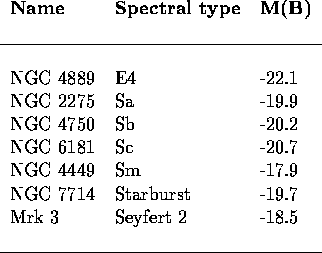
Table 1: The list of galaxies, with spectral type and B absolute magnitude.
NOTE
These spectra have been obtained with a drift scanning technique
for galaxies with diameters of 1-14 arcmin. This means that
each measurement consisted of one or more integrations, during
which the image of the galaxy was trailed across a long slit
several times. As a result, the integrated spectrum
takes into account the contribution of the light coming
from the galaxy nucleus, bulge and disk.
Perform the analysis of each galaxy spectrum
following these steps:
NOTE:
- To facilitate the identification of spectral features
we have summarized in Table 2 the main lines in emission
or in absorption in the integrated galaxy spectra.
The symbol
 in the table indicates the most usual and
strongest lines. The redshift of the galaxies is derived from:
in the table indicates the most usual and
strongest lines. The redshift of the galaxies is derived from:

where  is the measured value and
 is the rest-frame value given in Table 2.
All the galaxies are nearby and 0.001
is the rest-frame value given in Table 2.
All the galaxies are nearby and 0.001  z
z  0.021.
- The spectra provided are in F(
 ) and therefore a
definition of the
) and therefore a
definition of the  break slightly different
from that given in equation 1 will be used here. Consider
break slightly different
from that given in equation 1 will be used here. Consider

where  is the mean flux in the
(
is the mean flux in the
( wavelength range.
While the absolute value of the index will differ from the standard one,
its variations with the galaxy spectral types will remain unchanged.
wavelength range.
While the absolute value of the index will differ from the standard one,
its variations with the galaxy spectral types will remain unchanged.
- Measurements of EW and Fluxes
are very sensitive to the continuum definition. Therefore,
the students should repeat at least some measurements
considering different continuum windows and evaluate the
scatter in the results.
- For the conversion of the observed flux
 to luminosity L remember that

where
(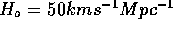 ; 1 Mpc = 3.08
  cm)
cm)
Commands for the spectral analysis
To start the program type: dipso.
Then type:
- alaslins 3 2000 To define the lines to be read.
- alasrd name file and push
To read one galaxy spectrum and store it in the current buffer.
- sl To see the content of all buffers
- pop buffer number
To read a from a buffer position to the current buffer
- dev xwindows To create a graphic window
- pm buffer number To plot the galaxy spectrum
in the specified buffer. Without specification the whole wavelength
range will be plotted. If one wish to define a type
xr x start x end and then pm again.
- erase To erase the plot on the screen.
Important
If one wishes a laser plot of the spectra
type first dev  l, then pm , then dev xwindows.
Postscript files with the gks*.ps, gks*.ps.1, gks*.ps.2 etc. names
will be created in the
working directory. After that, open another window on the screen with the
command xterm &. From this window one can send the gks*.ps.* files to the
laser with the command lpr gks*.ps.*.
l, then pm , then dev xwindows.
Postscript files with the gks*.ps, gks*.ps.1, gks*.ps.2 etc. names
will be created in the
working directory. After that, open another window on the screen with the
command xterm &. From this window one can send the gks*.ps.* files to the
laser with the command lpr gks*.ps.*.
To identify emission and absorption lines :
- xv and click with the cursor. Use Table 2
to identify the absorption or emission lines
(at least all those marked with
 )
and to measure the redshift.
)
and to measure the redshift.
To measure the  break of a galaxy spectrum type:
- rxr 3750 3950 to select the appropriate wavelength
range and pm
- push to store this wavelength region in a buffer
- pop buffer number
- mean to obtain the mean flux in this spectral region.
Do the same for 4050 4250.
To measure EW and Fluxes
- xr xstart xend to select a region around the line
to measure
- If the line has not a regular gaussian-like profile but
is contaminated by another line,
type snip and give with the cursor the limits of the region
you want to ignore in the
line profiles. A linear interpolation will be done.
Then type push to store the ``corrected''
profile in a buffer and pop (buffer number) to read it.
- ew To measure the EW of the lines. Mark one position
on each side of the line.
- flux To measure the flux of the lines.
Mark one position on each side of the line.
To deconvolve complex profiles
(sometime necessary for the  line complex )
- rxr x start x end to select only a region
around the line to measure
- yv to measure the continuum value and
ysub value to subtract it
- push to store the previous spectrum in a buffer
- pop buffer number to read the previous spectrum
- elfinp to define the number of gaussian components, the
central wavelengths, and the FWHMs.
A guess for the central Wavelength and Full Width at Half Maximum is required.
Type c1: number and w1: number.
More gaussian components can be given (
c2: number and w2: number).
- qelf to return to dipso
- elfopt to run the optimization program. It gives center,
width and line flux of the single gaussian components.
- elfpush [ n1, n2..] to store
the fit results in buffers. n1, n2 are the single
gaussian components. Without specification only
the total fitted profile will be stored
- In order to check the the reliability of the fit
type pop original profile then
- nb to avoid to erase the screen
- pop and pm single gaussian components
- pop and pm total fitted profile
- To perform again the profile analysis type
elfnewc to clean the input parameters of the previous fit
and erase
Next: References:
Up: No Title
Previous: Past and future
Roberto Saglia
Wed Aug 6 17:23:37 MET DST 1997
 in Table 2.
 ,
,  ,
,  ,
,
 ,
,  ,
,
 .
.
 ratio.
 (and optionally
 fluxes to the corresponding luminosities
 (and
(and  ) and calculate the SFR.
 versus spectral type
 versus spectral type
 versus EW(
 )
)