To create plots with complex mathematical labels, you can use the epslatex terminal, which delegates all the typesetting to LaTeX and allows you to use almost all of its text formatting capabilities. The procedure below requires gnuplot, latex, and ghostscript.
To make a plot, create a gnuplot script “plot.plt” using the epslatex terminal with the standalone option, for example:
set term epslatex standalone color linewidth 2 size 15cm,10cm
set output 'plot.tex'
set format '$%g$' # display tic labels in math mode, to get minus signs right
set palette defined (0 'yellow', 1 'orange', 2 'red', 3 'magenta', 4 'blue')
unset colorbox
set tmargin 5
set key at graph 1,1.21 right title '$n=$' maxrows 2 height 1.5
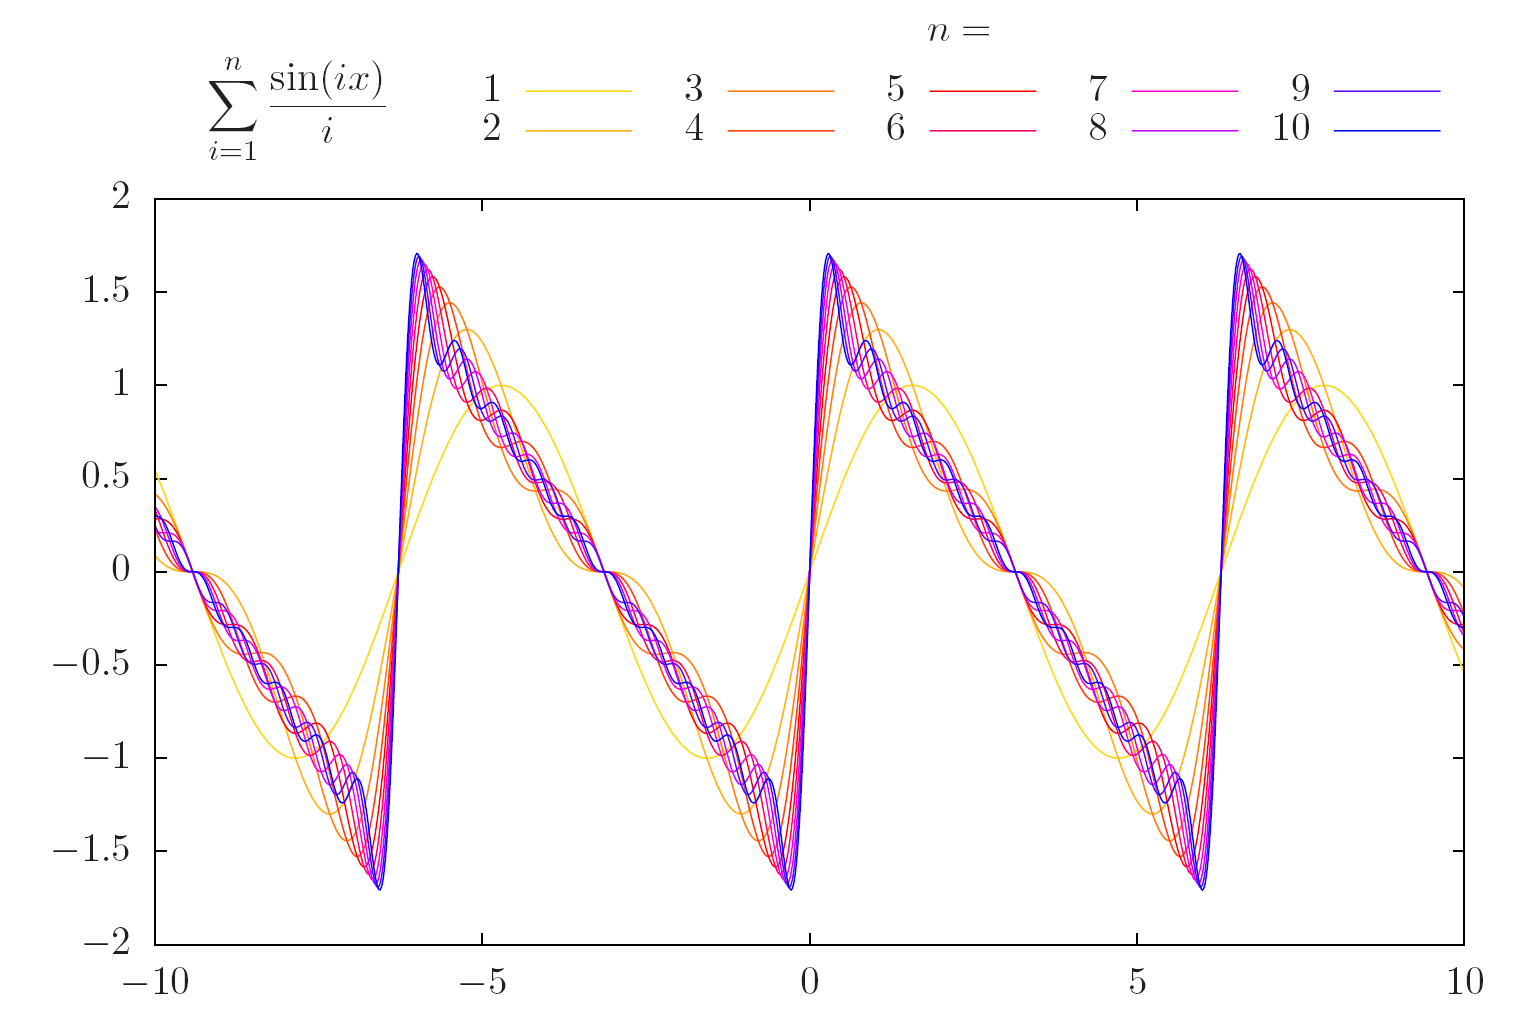
set label '$\displaystyle\sum_{i=1}^n {\sin(ix)\over i}$' at graph 0.04,1.12
set xrange [-10:10]
set yrange [-2:2]
set samples 1000
f(x,n) = (n==0)?(0):(sin(n*x)/n+f(x,n-1))
plot for [n=1:10] f(x,n) title ''.n lc palette frac n/10.
Process this with
gnuplot plot.plt; latex plot.tex; dvips plot.dvi; ps2pdf plot.ps
which will result in the final PDF file:
(You can of course process this with the help of a script or makefile, so you don't have to keep retyping these commands.)