T12: Visualization of Galaxies in cosmological simulations
We are going to use Splotch to visualize galaxies
out of the Magneticum simulations.
How to start:
- Log in to USM from your outside connection via ssh -Y numprakt@moon.usm.uni-muenchen.de, you might
remember the password from the numerical practicum, otherwise, ask us.
- Log in to our central workstation via ssh -Y numprakt@dorc1
- Change to the directory /ptmp2/T12 and create a new sub-directory for you.
- Copy from the WhatYouNeed directory Splotch6-generic and demo.par into your directory,
as well as the galaxies_*.txt files.
How to do your first image:
The galaxies_*.txt files contains a PATH in the first line and then a list of interesting objects, defined by
5 numbers: SNR and SUB defines the file and X, Y and Z the coordinate. Here an example:
/HydroSims/Magneticum/Box4/uhr_test/
SNR SUB X Y Z
136 12 44319.5 11750.2 15495.4
136 9 24555.5 37925.5 41413.5
036 10 32042.6 44672.2 22093.5
Now, edit the demo.par file:
- Construct the file name to be read for the object of interest: infile=[PATH]/snapdir_[SNR]/snap_[SNR].[SUB]
- Define the point where you want to look at by setting lookat_x=[X], lookat_y=[Y] and
lookat_z=[Z].
- Finally place the Camera at a useful position, e.g.: camera_x=[X], camera_y=[Y]+200 and
camera_z=[Z].
- Now execute Splotch by: ./Splotch6-generic demo.psr
You should have an image demo0000.tga which you can watch by xv demo.tga or display demo.tga.
How to improve your image:
Now you have a large range of possibilities to influence the appearance of the result. In general, lines starting
with # as well as unused or unknown parameters in the parameter file are ignored. ptypes=2
defines that you want to visualize two particles species and ptype0=0 defines that the first
species are the gas particles of the simulation and ptype1=4 defines that the second ones are
the star particles in the simulation. Accordingly, all parameters ending with 0 refer to the
gas particles and the one ending with 1 are referring to the stellar particles.
- brightness[0/1]=[value] controls the overall brightness a component becomes. If you set
it to 0 for a component then this component disappears.
- palette[0/1]=[filename] defines the color table used to translate a value to RGB color.
Have a look on the files in /ptmp2/T13/WhatYouNeed/palettes/ to see what you could us.
- outfile=[filename] controls the name of the image files produced and xres=[value]
and yres=[value] control the dimension of the produced image.
- pic_gamma=[value], pic_brightness=[value] and pic_contrast=[value] allow to
manipulate the final image. Note that gamma here is the real gamma correction, while programs
like photo shop or similar typically interpret gamma as 1/gamma, see also
here.
- You have various ways to change the appearance of your image by controlling the quantity which is used
to get visualized.
color_[min/max][0/1]=[value] allows to set the min/max values used. When you run Splotch it
displays you the underlying min/max values of all particles.
color_log[0/1]=[TRUR/FALSE] allows to use the logarithm of the quantity (if you change, do not forget
to adapt the min/max values accordingly.
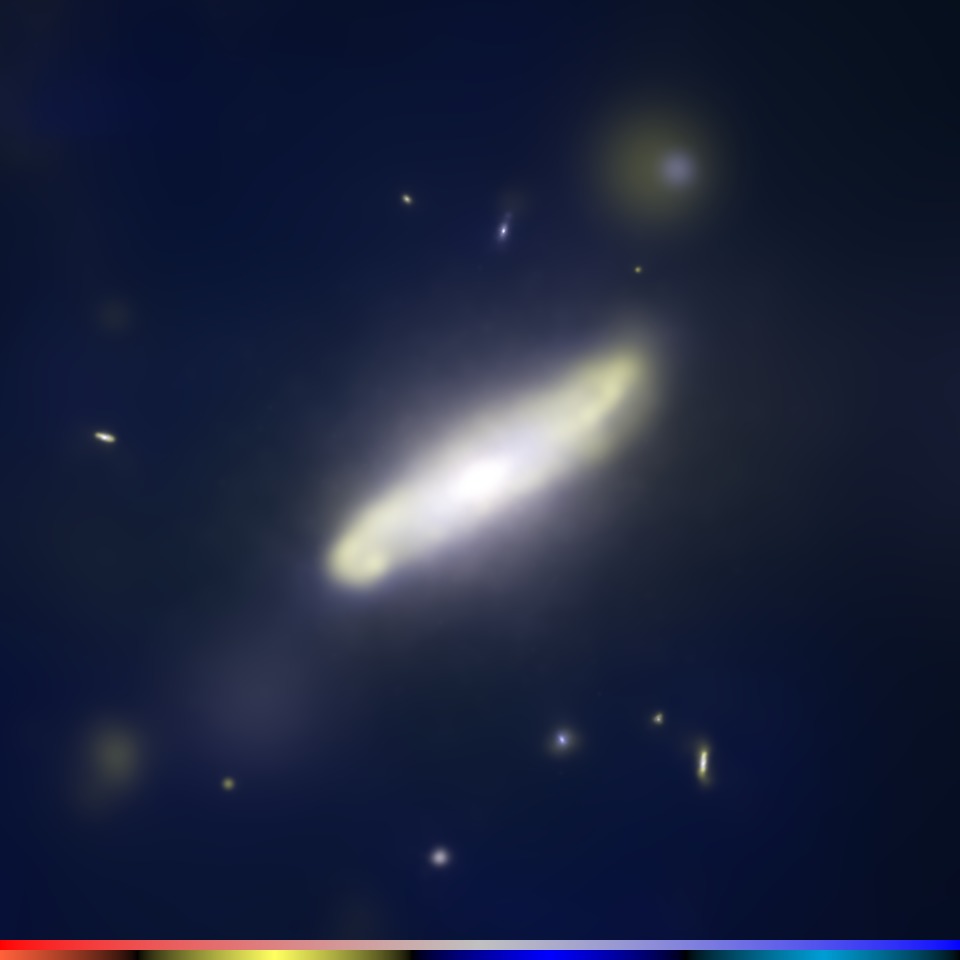
How to make a movie:
Splotch allows you to create image sequences directly in a very simple way. You create just a file
with the evolution of some of the parameters and Splotch will produce an image for each line in
the file. So simply:
When you now run Splotch files with increasing numbers will be created, which you can glue together as a
movie after wards. For example you can set the camera position as a circle around the object, see the movie below.
How to explore the unknown:
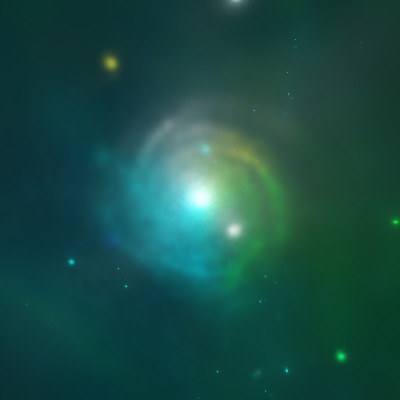
- You have the possibility to visualize (3D) vector quantities directly as RGB. Take the first galaxy from
above example and change:
color_label[0/1]=VEL
color_present[1/1]=63
color_is_vector[0/1]=TRUE
color_log[0/1]=FALSE
color_asinh[0/1]=TRUE
color_min[0/1]=-5
color_max[0/1]=5
Now re-run Splotch. The colors indicate the direction of the velocity and you should be able to identify
coherent motions (see example image below).
- Explore the galaxies in box3_uhr, do you find interesting ones ?
Example Image/Movie::