Reviews in Modern Astronomy Vol. 16
Hot Stars:
Old-Fashioned or Trendy?
A. W. A. Pauldrach
Institut für Astronomie und Astrophysik der Universität München
Scheinerstraße 1, 81679 München, Germany
uh10107@usm.uni-muenchen.de, http://www.usm.uni-muenchen.de/people/adi/adi.html
Abstract
Spectroscopic analyses with the intention of the interpretation
of the UV-spectra of the brightest stars as individuals
– supernovae –
or as components of star-forming regions
– massive O stars –
provide a powerful tool with great astrophysical potential for
the determination of extragalactic distances and of the chemical
composition of star-forming galaxies even at high redshifts.
The perspectives of already initiated work with the new generation
of tools for quantitative UV-spectroscopy of Hot Stars that have been
developed during the last two decades are presented and the status
of the continuing effort to construct corresponding models for Hot
Star atmospheres is reviewed.
Because the physics of the atmospheres of Hot Stars are strongly
affected by velocity expansion dominating the spectra at all wavelength
ranges, hydrodynamic model atmospheres for O-type stars and explosion
models for Supernovae of Type Ia are necessary as basis for the
synthesis and analysis of the spectra.
It is shown that stellar parameters, abundances and stellar wind
properties can be determined by the methods of spectral diagnostics
already developed.
Additionally, it will be demonstrated that models and synthetic
spectra of Type Ia Supernovae of required quality are already
available that make it possible to tackle the question of whether
Supernovae Ia are standard candles in a cosmological sense and
the SN-luminosity distances thus indicate accelerated expansion of
the universe.
In detail we discuss applications of the diagnostic techniques
on two of the most luminous O supergiants in the Galaxy and a
standard Supernova of Type Ia.
Furthermore, it is demonstrated that the spectral energy distributions
provided by state-of-the-art models of massive O stars lead
to considerably better agreement with observations if used for the
analysis of H II regions.
Thus, an excellent way of determining extragalactic abundances and
population histories is offered.
Moreover, the important role that Hot Stars play in a broad
astrophysical context will be discussed.
As they dominate the physical conditions of their local environments
and the life cycle of gas and dust of their host galaxies, special
emphasis will be given to the corresponding diagnostic perspectives.
Beyond that, the relevance to cosmological issues of Hot Stars will
be considered.
1. Introduction
As is well known, Hot Stars are not a single group of objects.
Instead, the term covers sub-groups of objects in different parts of
the HR diagram and at different evolutionary stages.
The most important sub-groups are massive O/B stars, Central Stars
of Planetary Nebulae, and Supernovae of Type Ia and II.
All these sub-groups have in common that they are characterized by
high radiation energy densities and expanding atmospheres.
Thus, the state of the outermost parts of these objects is due to
these properties characterized by non-equilibrium thermodynamics.
In order to cover the best-known fundamental stages of Hot Star stellar
evolution in sufficient depth this review will be restricted to the
discussion of O stars and Supernovae of Type Ia; we will
not discuss objects like Wolf-Rayet stars, Luminous Blue Variables,
Be-stars, Supernovae of Type II, and others.
Beyond that, Hot Stars play an important role in a broad astrophysical
context.
This implies that a complete review covering all aspects in theory
and observation is not only impossible, but also beyond the scope of
this review.
Thus, this review will focus on a special part of the overall topic
with the intent of concentrating on just one subject; the subject
chosen is UV spectral diagnostics.
It will be shown, however, that this subject has important implications
on astrophysical topics which are presently regarded as being
“trendy”.
But first of all we have to clarify what is meant by UV spectral
diagnostics.
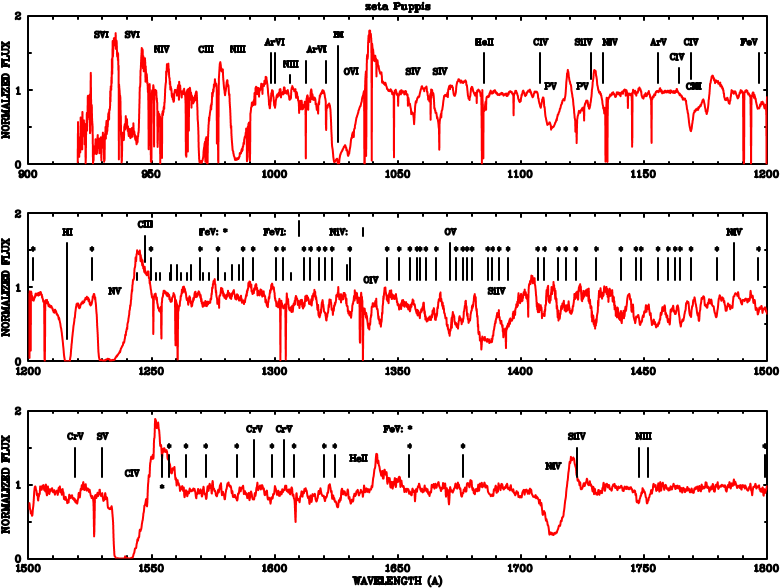
This is best illustrated by the really old-fashioned (1977, Morton
& Underhill) UV spectrum of one of the brightest massive
O stars, the O4 I(f) supergiant ζ Puppis.
As is shown in Figure 1, expanding
atmospheres have a pronounced effect on the emergent spectra of hot
stars – especially in the UV-part.
The signatures of outflow are clearly recognized by the blue-shifted
absorption and red-shifted emission in the form of the well-known
P Cygni profiles.
It is quite obvious that these kind of spectra contain information
not only about stellar and wind parameters, but also about abundances.
Thus, in principle, all fundamental parameters of a hot star can be
deduced from a comparison of observed and synthetic spectra.
Although spectra of the quality shown in
Figure 1 have been available for more
than 25 years, most work done has concentrated on qualitative results
and arguments.
In view of the effort that goes into the development of modern –
state-of-the-art – instruments, it is certainly not sufficient
to restrict the analyses to simple line identifications and qualitative
estimates of the physical properties.
The primary objective must be to extract the complete physical
stellar information from these spectra; and such diagnostic issues
principally have been made possible by the superb sensitivity and
spectral resolution of the spectra available.
The key for this purpose are realistic synthetic UV spectra for
Hot Stars.
Such powerful tools, which, however, are still in development and not
yet in widespread use, offer the opportunity to determine the stellar
parameters, the abundances of the light elements – He, C, N, O,
Si – and of the heavy elements like Fe and Ni, quantitatively,
as is indicated not only by IUE, but also more recent HST, ORFEUS, and
FUSE observations of hot stars in the Galaxy and Local Group galaxies.
All these observations show that the spectra in the UV spectral
range are dominated by a dense forest of slightly wind-affected
pseudo-photospheric metal absorption lines superimposed by broad
P Cygni line profiles of strong, mostly resonance lines formed
in different parts of the expanding atmosphere.
Thus, the obvious objective is to investigate the importance of these
lines with respect to the structure of the expanding atmospheres that
are characterized by the strength and the velocity of the outflow,
which in turn mainly determines the shape of the spectral lines.
It is actually not surprising that it turned out within the last
30 years that this objective, which will also be the primary
objective of this paper to review, represents not an easy task.
Before we discuss in detail the status quo of the diagnostic tool
required (Section 6), we will first examine in the following
parts of this review whether such a tool has been obsoleted by the
general development in astrophysics or whether it is still relevant
for current astronomical research.
For this purpose we first discuss the diagnostic perspectives of
galaxies with pronounced current star formation.
Due to the impact of massive stars on their environment the underlying
physics for the spectral appearance of starburst galaxies are rooted in
the atmospheric expansion of massive O stars which dominate the
UV wavelength range in star-forming galaxies, and that therefore the
UV-spectral features of massive O stars can be used as tracers
of age and chemical composition of starburst galaxies even at high
redshift (Section 2).
With respect to the present cosmological question of the
reionization of the universe – which appeared to have happened
at a redshift of about z ~ 6 – the ionization
efficiency of a top-heavy Initial Mass Function for the first
generations of stars is discussed (Section 3).
Starting from the impact of massive stars on their environment
it is demonstrated that the spectral energy distributions provided
by state-of-the-art models of massive O stars lead to
considerable improvements if used for the analysis of
H II regions.
Thus, the corresponding methods for determining extragalactic
abundances and population histories are promising (Section 4).
Regarding diagnostic issues, the role of Supernovae of Type Ia
as distance indicators is discussed.
The context of this discussion concerns the current surprising result
that distant SNe Ia appear fainter than standard candles in an
empty Friedmann model of the universe (Section 5).
Finally, we discuss applications of the diagnostic techniques on two
of the most luminous O supergiants in the Galaxy; additionally,
basic steps towards realistic synthetic spectra for Supernovae of
Type Ia are presented (Section 7).
2.
The impact of massive stars on their Environment –
UV Spectral Analysis of Starburst Galaxies
The impact of massive stars on their environment in the present
phase of the universe is of major importance for the evolution of
most galaxies.
Although rare by number, massive stars dominate the life cycle of gas
and dust in star forming regions and are responsible for the chemical
enrichment of the ISM, which in turn has a significant impact on the
chemical evolution of the host galaxy.
This is mainly due to the short lifetimes of massive stars, which
favours the recycling of heavy elements in an extremely efficient way.
Furthermore, the large amount of momentum and energy input of these
objects into the ISM controls the dynamical evolution of the ISM.
This takes place in an extreme way, because massive stars mostly group
in young clusters, producing void regions around themselves and wind-
and supernova-blown superbubbles around the clusters.
These superbubbles are ideal places for further star formation,
as numerous Hubble Space Telescope images show.
Investigation of these superbubbles will finally yield the required
information to understand the various processes leading to continuous
star formation regions (cf. Oey and Massey 1995).
The creation of superbubbles is also responsible for the phenomenon
of galactic energetic outflows observed in starbursts (Kunth
et al. 1998) and starburst galaxies even at high redshift
(Pettini et al. 1998).
It is thus not surprising that spectroscopic studies of galaxies
with pronounced current star formation reveal the specific
spectral signatures of massive stars, demonstrating in this
way that the underlying physics for the spectral appearance of
starburst galaxies is not only rooted in the atmospheric expansion
of massive O stars, but also dominated by these objects
(cf. Figure 2 from Steidel
et al. 1996, for star-forming galaxies at high redshift see
also Pettini et al. 2000, and for UV line spectra of local
star-forming galaxies see Conti et al. 1996; note that the
similarity of the spectra at none/low and high redshifts suggests a
stellar content which is similar or not too different).
The characteristic P cygni lines observed as broad stellar
wind lines, especially of the resonance lines of
C IV and
Si IV, integrated over the stellar
populations in the spectra of starbursting galaxies, allow quantitative
spectroscopic studies of the most luminous stellar objects in distant
galaxies even at high redshift.
Thus, in principle, we are able to obtain important quantitative
information about the host galaxies of these objects, but diagnostic
issues of these spectra require among other things synthetic UV
spectra of O-type stars as input for the population synthesis
calculations which are required for a comparison with the observed
integrated spectra.
What can be learned from an analysis of these spectra can
nevertheless be investigated in a first step by using observed
UV spectra of nearby O-type stars as input for the corresponding
population synthesis calculations instead.
In the frame of this method stars are simulated to form according
to a specified star-formation history and initial mass function and
follow predefined tracks in the HR-diagram.
The integrated spectra are then built up from a library of observed
UV spectra of hot stars in the Galaxy and the Magellanic Clouds.
The output of this procedure is semi-empirical UV spectra between
1000 and 1800 Å at 0.1 to 0.7 Å resolution for
populations of arbitrary age, star-formation histories and initial
mass function.
The computational technique of this method is described in the
literature comprehensively and we refer the reader to one of the
latest papers of a series (Leitherer et al. 2001).
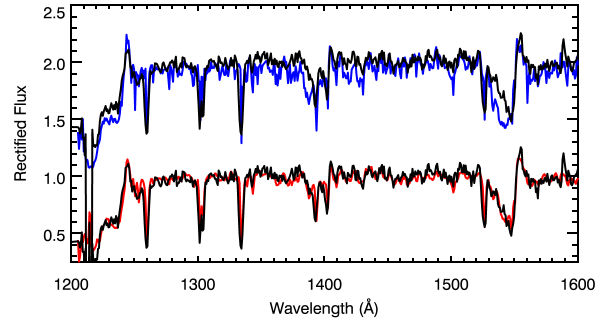
As an example of the analyses performed in this way a comparison
of the average spectrum of 8 clusters in NGC 5253 to synthetic
models at solar (top) and 1/4 solar (bottom) metallicity is shown
in Figure 3
(Leitherer et al., 2001).
The Figure shows clearly that a representative value of the overall
metallicity of this starburst galaxy can be determined, since the
model spectrum in the lower part fits the observation almost perfectly.
This result is especially convincing as both models (dashed lines)
are based on the same parameters, except for the metallicity.
A standard Salpeter IMF between 1 and 100 Msun
was used and the starburst has been assumed to last 6 Myr,
with stars forming continuously during this time.
The worse fit to the observations produced by the solar metallicity
model spectrum – particularly discrepant are the blue absorption
wings in Si IV and
C IV which are much too strong in
the models – could be improved by reducing the number of the
most massive stars with a steeper IMF, but at the price of a worse
fit to the emission components.
As an important result the ratio of the absorption to the emission
strengths is therefore a sensitive indicator for the metallicity.
Moreover, the strong sensitivity of the emission parts of the
P Cygni lines of
N V,
Si IV and
C IV on the evolutionary stage of
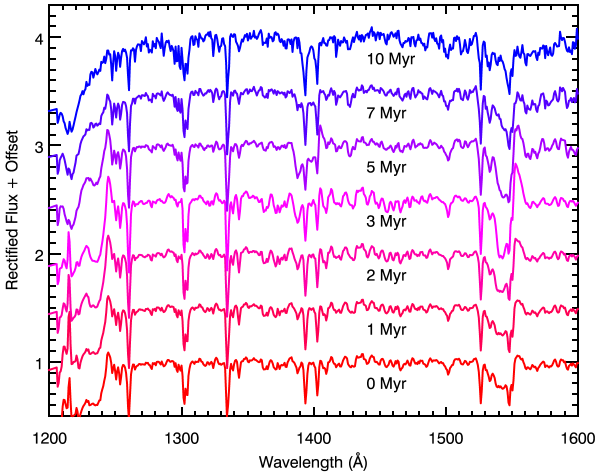
the O stars makes these spectra quite suitable as age tracers.
As is shown in Figure 4, where the
time evolution of the integrated spectrum following an instantaneous
starburst is presented.
The line profiles gradually strengthen from a main-sequence
dominated population at 0–1 Myr to a population with luminous
O supergiants at 3–5 Myr; and the lines weaken again
at later age due to termination of the supergiant phase –
this behavior is especially visible in the shape of the
C IV λ1550
resonance line.
The conclusion from these examples is that this kind of analysis
is very promising, but relies on observed UV spectra, which are
just available for a small number of metallicity values, namely those
of the Galaxy and the Magellanic Clouds.
In order to make progress in the direction outlined before,
realistic synthetic UV Spectra of O-type stars are needed.
This is in particular the case for high-redshift galaxies observable
spectroscopically when the flux is amplified by gravitational
lensing through foreground galaxy clusters, since in this cases the
expected metallicities of starbursting galaxies in the early universe
(cf. Pettini et al. 2000) are most probably different
from local ones.
3. First generations of Stars –
Ionization Efficiency of a Top-Heavy Initial Mass Function
Apart from the short evolutionary timescale of massive stars it is
obviously the metallicity, and connected to that the steepness of the
Initial Mass Function, which is responsible for the rarity of these
objects in the present phase of the universe.
It has to be the metallicity, because very recently strong evidence
has been found that the primordial IMF has favored massive stars
with masses > 102 Msun
(cf. Bromm et al. 1999).
Thus, in the early universe, when just primordial elements left over
from the Big Bang, nature obviously preferred to form massive stars.
This prediction is based on the missing metallicity which leads
to a characteristic scale for the density and temperature of the
primordial gas, which in turn leads to a characteristic Jeans mass
of MJ ~ 103 Msun
(Larson 1998).
Finally, due to these physical conditions the Initial Mass
Function becomes top-heavy and therefore deviates significantly
from the standard Salpeter power-law (see, for instance, Bromm
et al. 1999, 2001).
Such an early population of very massive stars at very low
metallicities (i.e., Population III stars) which have already
been theoretically investigated by El Eid et al. (1983),
recently turned out to be also relevant for cosmological issues.
The most important of these issues concerns the cosmological question
when and how the cosmic “dark ages” ended (Loeb 1998).
We know they ended because the absence of a Gunn-Peterson trough
(Gunn & Peterson 1965) in the spectra of high-redshift
quasars implies that the universe was reionized again at a redshift
of z > 5.8 (Fan et al. 2000).
Carr et al. (1984) suspected since a long time that the
first generations of stars have been relevant to control this process.
Thus, Population III stars could contribute significantly to the
ionization history of the intergalactic medium (IGM), but the
contribution of the first generation of stars to the ionization
history of the IGM depends crucially on their initial mass function.
With regard to the first generations of stars the ionization
efficiency of a top-heavy Initial Mass Function therefore will have
to be investigated.
It is the enormous amount of UV and EUV radiation of these very
massive stars which could easily change the status of the cold and
dark universe at that time to become reionized again.
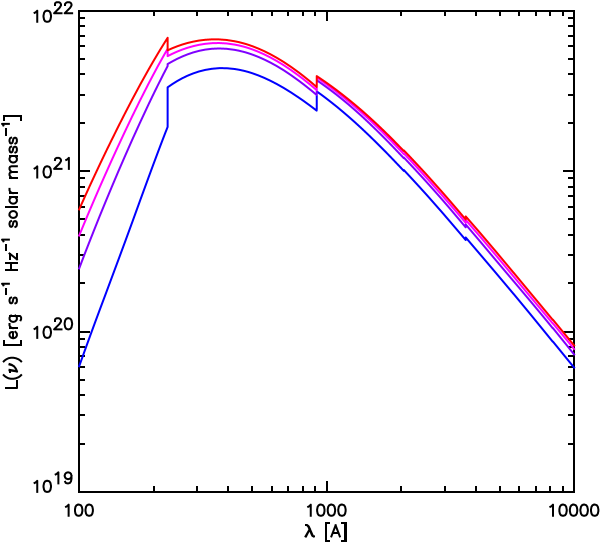
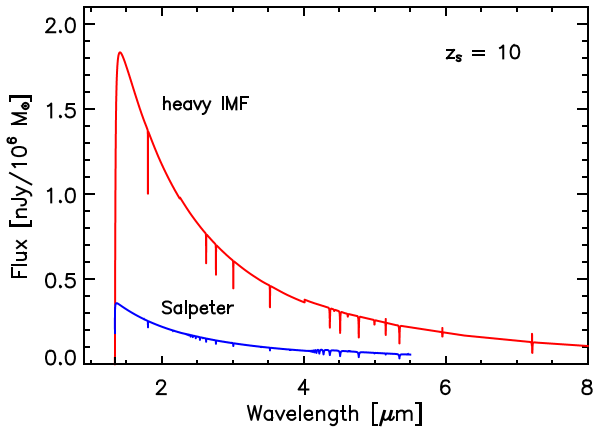
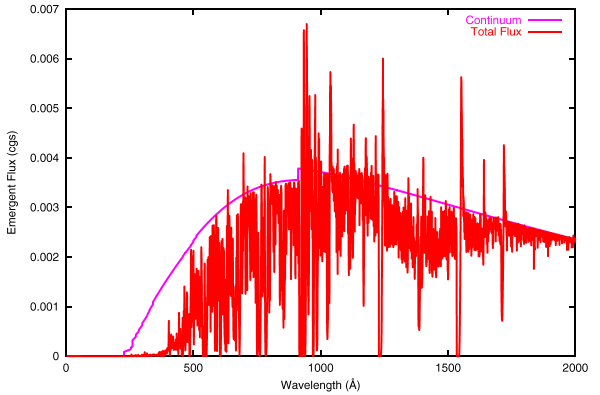
This is indicated in Figure 5
which also shows that the total spectral luminosity depends solely on
the total amount of mass, if the mass of the most massive stars exceeds
300 Msun (cf. Bromm et al. 2001).
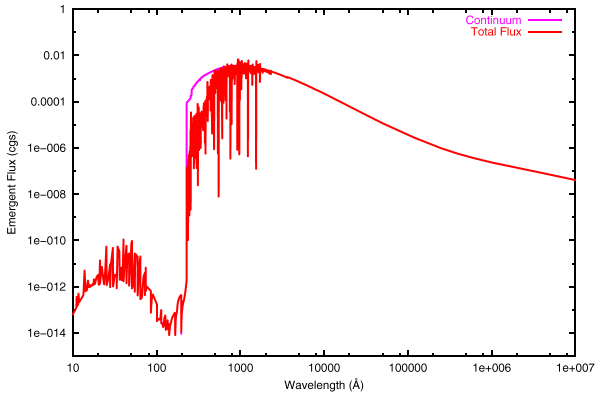
In this case of a top-heavy Initial Mass Function the total spectral
energy distribution deviates significantly from that obtained with
the standard Salpeter power-law, as is shown in
Figure 6, and the flux obtained
can contribute the decisive part to the unexplained deficit of ionizing
photons required for the reionization of the universe
(cf. Bromm et al. 2001).
However, in order to be able to make quantitative predictions
about the influence of this extremely metal poor population of very
massive stars on their galactic and intergalactic environment one
needs primarily observations which can be compared with the predicted
flux spectrum.
Future observations with the Next Generation Space Telescope of
distant stellar populations at high redshifts will principally give
us the opportunity to deduce the primordial IMF from these comparisons.
That this is generally possible has been shown very recently
by Kudritzki (2002), who calculated state-of-the-art
UV spectra for massive O stars in a metallicity range of
1–10−4 Zsun.
From an inspection of his spectra he concluded that significant line
features are still detectable even at very low metallicities; thus,
there will be diagnostic information available to deduce physical
properties from starbursting regions at high redshifts that will
eventually be observed with the Next Generation Space Telescope in
the infrared spectral region.
As a second requirement we need to determine the physical properties
of Population III stars during their evolution.
A key issue in this regard are realistic spectral energy
distributions calculated for metallicities different from zero
for the most massive objects, since the assumption of a metallicity
of Z = 0 is certainly only correct for the very
first generation of Population III stars.
4. Theoretical Ionizing Fluxes of O Stars
Although less spectacular, we will now investigate the impact of
massive stars on their environment in a more direct manner.
Apart from the chemical enrichment of the ISM, the large amount of
momentum and energy input into the ambient interstellar medium of
these objects is primarily of importance.
Especially the radiative energy input shortward of the Lyman edge,
which ionizes and heats the Gaseous Nebulae surrounding massive
Hot Stars, offers the possibility to analyze the influence of the
EUV radiation of the photoionizing stars on the ionization
structure of these excited H II regions.
The primary objective of such investigations are studies of
theoretical models of starburst regions, which for instance are used
to determine the energy source in ultra-luminous infrared galaxies
– ULIRGs – (cf. Lutz et al. 1996; Genzel
et al. 1998).
The interpretation of the corresponding extra-galactic observations
obviously requires understanding the properties of the spectral energy
distributions (SEDs) of massive stars and stellar clusters.
Thus, the quality of the SEDs has to be probed in a first step by
means of investigations of Galactic
H II regions.
4.1. The Excitation of Galactic H II Regions
Giveon et al. (2002) recently presented a
comparison of observed [Ne III]
15.6 μm / [Ne II]
12.8 μm and [Ar III]
8.99 μm / [Ar II]
6.99 μm excitation ratios, obtained for a sample of 112
Galactic H II regions and 37
nearby extragalactic H II regions
in the LMC, SMC, and M33 observed with the ISO-SWS observatory,
with the corresponding results of theoretical nebular models.
The authors have chosen infrared fine-structure emission lines for
their investigation because these lines do not suffer much from dust
extinction and the low energies of the associated levels make these
lines quite insensitive to the nebular electron temperature.
Moreover, the relative strengths of the fine-structure
emission lines chosen are ideal for constraining the shape
of the theoretical ionizing fluxes, since the
[Ne III]
15.6 μm / [Ne II]
12.8 μm line ratio depends on photons emitted
at ≥ 3 Rydbergs, while
[Ar III]
8.99 μm / [Ar II]
6.99 μm is sensitive to the region ≥ 2 Rydbergs.
Thus, these line ratios are extremely useful probes of the physical
properties of H II regions
and their associated ionizing sources especially with regard to the
ionizing spectral energy distributions.
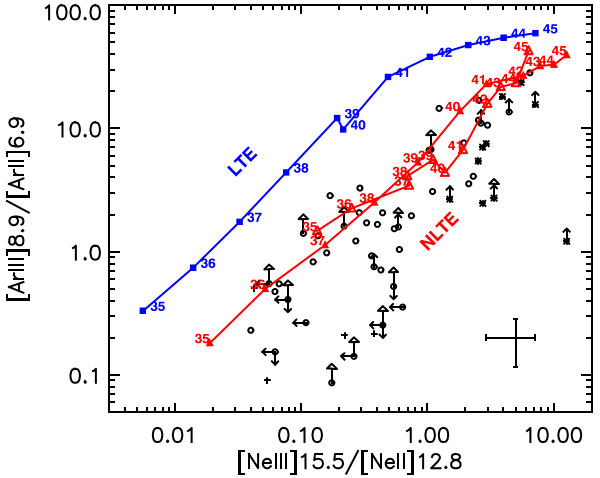
The complete set of observed emission line ratios of Ne and Ar
is shown in Figure 7 together with
corresponding results of nebular model computations for which solar
metallicity and a gas density of 800 cm−3
has been assumed, and which are based on LTE (static atmosphere
from Kurucz, 1992) as well as NLTE (expanding atmosphere from
Pauldrach et al. 2001) spectral energy distributions.
The diagnostic diagram clearly shows that the predicted nebular
excitation increases with increasing effective temperature of
the photoionizing star, and it also shows that the high excitation
[Ne III] emission observed in
H II regions is by far not
reproduced by nebular calculations which make use of the ionizing
fluxes of LTE models – the line ratios are under-predicted by
factors larger than 10.
This result is clearly an example of the well-known
Ne III problem
(cf. Baldwin et al. 1991;
Rubin et al. 1991;
Simpson et al. 1995).
It is quite evident, however, that the quality of the diagnostics
depends primarily on the quality of the input, i.e., the spectral
energy distributions.
It is therefore a significant step forward that the ionizing fluxes
of the NLTE models used represent an impressive improvement to the
observed excitation correlation – note that the fit shown in
Figure 7 may actually be even better,
since a lot of the scatter is due to underestimated extinction
corrections for the [Ar III]
8.99 μm line.
The NLTE sequence also indicates that for most of the considered
H II regions the effective
temperatures of the exciting stars lie in the range of 35 000
to 45 000 K.
But, most importantly, the NLTE models can readily account for
the presence of high excitation
[Ne III] emission lines in
nebular spectra, and this result resolves the long-standing
Ne III problem and supports the
conclusion of Sellmaier et al. (1996), who found on
basis of a less comprehensive sample of
H II regions and models
for the first time that this problem has been the failure of
LTE photoionization simulations due primarily to a significant
under-prediction of Lyman photons above 40 eV, and that this
issue is solved by making use of NLTE model atmospheres.
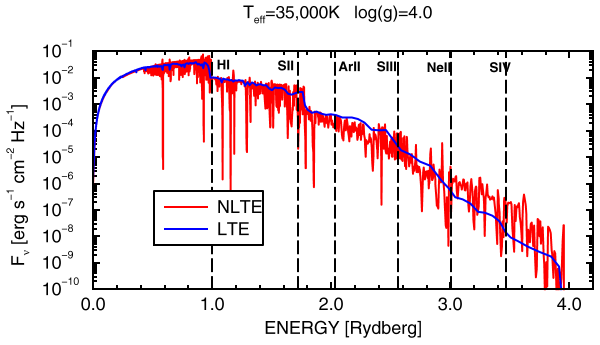
The reason for this improvement are the spectral shapes of
the NLTE fluxes shortward of the Ar II
and Ne II ionization thresholds which
are obviously somewhat more realistic in the NLTE case.
This is illustrated in Figure 8
where the spectral energy distributions of an LTE and an NLTE
model are compared for a dwarf with an effective temperature of
35 000 K.
As is shown the SEDs harden in the NLTE case, meaning that the LTE
model produces much less flux above the Ne+ 40.96 eV
threshold than the NLTE model – this is the behavior that is
essentially represented in the excitation diagram.
4.2. Spectral Energy Distributions of Time-Evolving Stellar Clusters
The improvement obtained for the diagnostic diagram of the analysis
of Galactic H II regions in
Section 4.1 also has important implications for determining
extragalactic abundances and population histories of starburst
galaxies.
With regard to this, Thornley et al. (2000)
carried out detailed starburst modelling of the
[Ne III]
15.6 μm / [Ne II]
12.8 μm ratio of
H II regions ionized by clusters of stars.
As was shown above, the hottest stars in such models are
responsible for producing large nebular
[Ne III]
15.6 μm / [Ne II]
12.8 μm ratios.
Hence, the low ratios actually observed led to the conclusion that the
relative number of hot stars is small due to aging of the starburst
systems.
Thus, the solution of the Ne III
problem has important consequences for the interpretation
of these extragalactic fine-structure line observations,
since the conclusion that due to the low
[Ne III]
15.6 μm / [Ne II]
12.8 μm ratios obtained, the hottest stars as dominant
contributors to the ionization of the starburst galaxies have to be
removed, has obviously to be proven.
In order to tackle this challenge, Sternberg et al. (2002)
computed spectral energy distributions of time-evolving stellar
clusters, on basis of a large grid of calculated NLTE spectral energy
distributions of O and early B-type stars in the hot, luminous part
(Teff > 25 000 K) of the
HR diagram, from which models of stars following evolutionary
tracks are suitably interpolated, and which are the major contributors
to the Lyman and He I fluxes.
The SEDs used rely on recent improvements of modelling expanding NLTE
atmospheres of Hot Stars (Pauldrach et al. 2001).
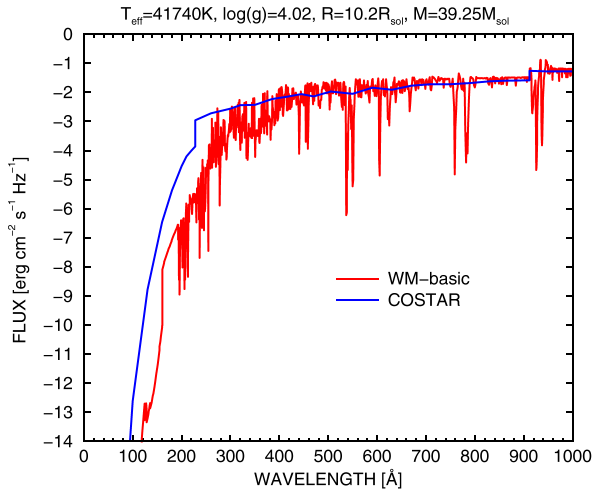
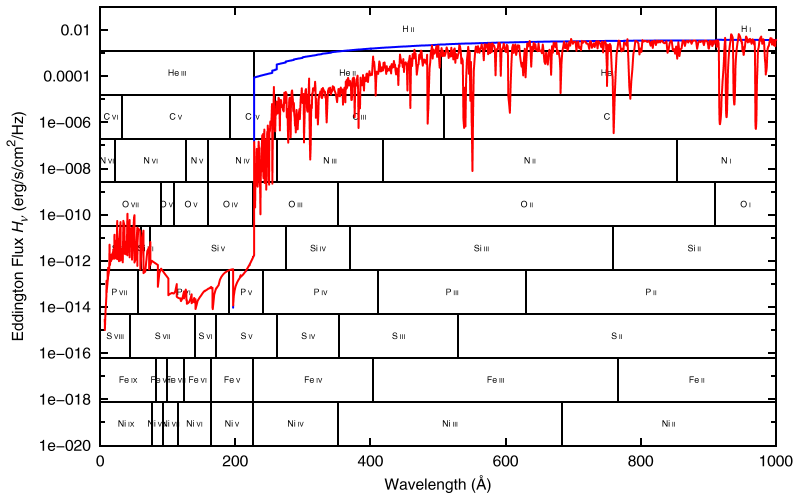
As an example of the individual models used,
Figure 9 shows the calculated
spectral energy distribution of a typical O star compared to
the corresponding result of an NLTE model of Schaerer & de Koter
(1997).
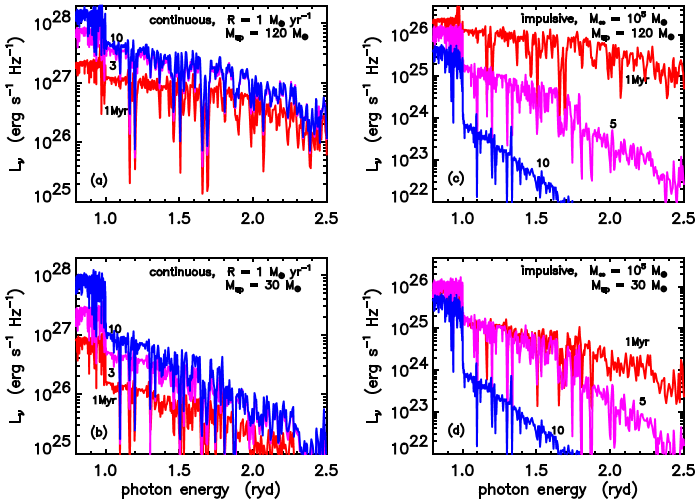
The spectral energy distributions have been calculated for two modes
of cluster evolution, a continuous and an impulsive one.
The different spectral evolutions of these modes are shown in
Figure 10 with regard to the
spectral range of 0.8–2.5 Rydbergs.
Concerning the continuous mode, the star-formation rate is
assumed to be constant with time – this regards time scales
which are longer that the lifetimes of massive stars – and
it is further assumed that the cluster forms stars at a rate of
1 Msun per year.
In the impulsive mode, all stars are formed
“instantaneously”, i.e., on time scales which are much
shorter than the lifetimes of massive stars; the total mass of stars
formed is 105 Msun, and the cluster is
assumed to evolve passively thereafter.
Furthermore, the computations are based on a Salpeter initial mass
function, where for each mode two cases, one with an upper mass limit
of Mup = 120 Msun
and the other one with an upper mass limit of
Mup = 30 Msun,
are assumed.
Two striking effects are seen in
Figure 10:
1.
In the continuous mode, the cluster ionizing spectrum becomes softer
– i.e., steeper – between 1 and 10 Myr.
This is due to the increase of the relative number of late versus
early-type OB stars during the evolution, since the less massive
late-type stars have longer lifetimes.
This effect is particularly noticeable for the cluster model with
Mup = 120 Msun.
2.
In the impulsive mode, the magnitude of the Lyman break increases
drastically, because the massive stars disappear with time.
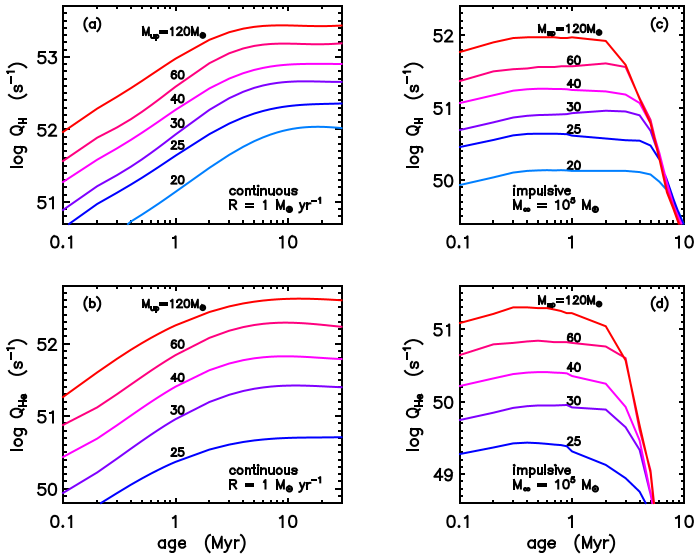
The evolution of the photon emission rates for photons above the
Lyman (QH) and the
He I (QHe) ionization
thresholds is shown in Figure 11
for both modes of the clusters.
The key difference between the two modes leads to completely different
shapes of the photon emission rates, which will be easy to distinguish
in view of their photoionizing properties acting on their gaseous
environments.
It is also shown that increasing the upper IMF mass cut-off increases
the photon emission rates, but does not change the shapes of the
rates obtained during the evolution.
The methods developed for determining extragalactic abundances and
population histories from an analysis of
H II regions are thus very
promising.
From these investigations it is obvious that realistic spectral
energy distributions of massive stars and stellar clusters are
important for studies of their environments.
But the crucial question of whether the spectral energy distributions
of massive stars are already realistic enough to be used for diagnostic
issues of H II regions has
not been answered yet, since on basis of the results obtained
for the diagnostic diagram in Section 4.1 we cannot yet
exclude that wrong fluxes could show the same improvements in the
Ne++/Ne+ ratios just by chance.
An answer to this question requires an ultimate test!
This ultimate test is only provided by a comparison of the
observed and synthetic UV spectra of the individual massive stars,
due to two reasons:
- This test involves hundreds of spectral signatures of various
ionization stages with different ionization thresholds which cover
a large frequency range.
- Almost all of the ionization thresholds lie within the
spectral range shortward of the Lyman ionization threshold
(cf. Figure 12); thus, the
ionization balances of all elements depend sensitively on the ionizing
radiation throughout the entire wind.
The ionization balance can be traced reliably through the strength
and structure of the wind lines formed throughout the atmosphere.
Hence, it is a natural and the only reliable step to test the quality
of the ionizing fluxes by virtue of their direct product:
the UV spectra of O stars.
But before we turn to this test we will continue our discussion
with another astrophysically important stellar object.
5. Supernovae of Type Ia as Distance Indicators
In order to complete the discussion of Hot Stars in the context
of modern astronomy, we will concentrate now, as a last point, on
the subject of Supernovae of Type Ia.
With respect to diagnostic issues we will investigate the role of
Supernovae of Type Ia as distance indicators.
The context of this discussion regards, as a starting point, the
current surprising result that distant SNe Ia at intermediate
redshift appear fainter than standard candles in an empty Friedmann
model of the universe.
Type Ia supernovae, which are the result of the thermonuclear
explosion of a compact low mass star, are currently the best
known distance indicators which due to their large luminosities
(Lmax ~ 1043 erg/s) reach
far beyond the local supercluster (cf. Saha et al. 2001
and references therein).
It is thus not surprising that Type Ia supernovae have become the
most important cosmological distance indicator over the last years,
and this is not only due to their extreme brightness – it is
primarily due to their maximum luminosity which can be normalized
by their light curve shape, so that these objects can be regarded as
standard candles.
That this actually is the case has been shown by observations of local
SNe Ia which define the linear expansion of the local universe
extremely well (Riess et al. 1999), and this is convincing
proof of the accuracy of the measured distances.
On the other hand, observations of distant SNe Ia (up to redshifts
of about 1) have yielded strong evidence that the expansion rate has
been accelerated 6 Gyr ago (cf. Riess et al. 1998
and Perlmutter et al. 1999).
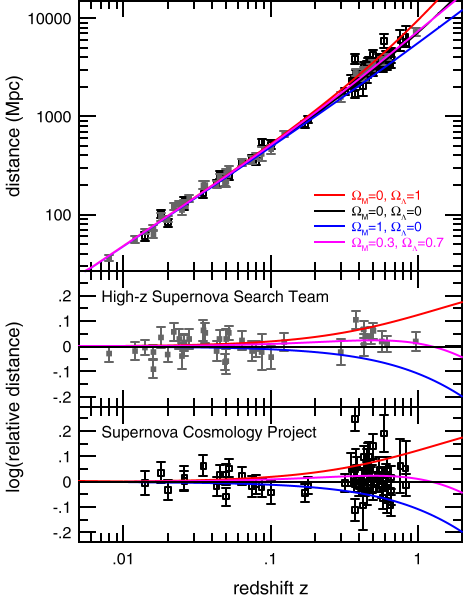
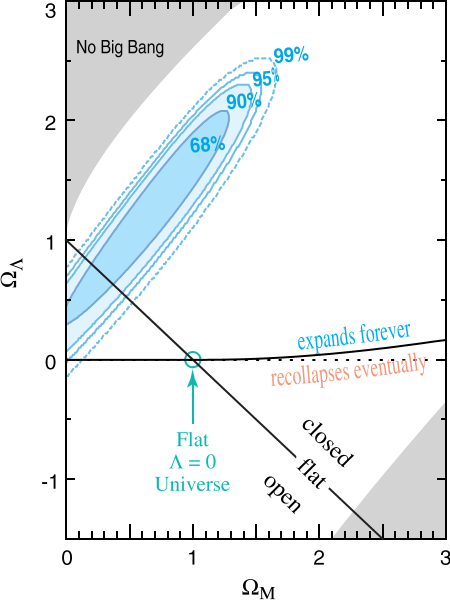
This surprising result becomes evident if we look at the
Hubble diagram in the form of distance modulus versus redshift
(cf. Figure 13).
As is shown in the diagrams of the lower panels, which are normalized
to a cosmological model for an empty universe, most SNe Ia
at intermediate redshift are positioned at positive values of the
normalized distance modulus; thus, the distant supernovae appear
fainter than what would be expected in a empty universe.
This means that deceleration from gravitational action of the matter
content does not take place.
Moreover, the SNe Ia appear even more distant indicating an accelerated
expansion over the last 6 Gyr.
The implications of this are immediately recognized in the
cosmological diagram on the right-hand side of
Figure 13, where
ΩΛ versus
ΩMass is plotted.
The SN Ia results obviously exclude any world model with matter
without a contribution by a cosmological constant; hence, the need
for an energy contribution by the vacuum is shown.
Thus, the SN luminosity distances indicate accelerated expansion
of the universe!
However, this is not the only interpretation of the result obtained.
There are other astrophysical explanations, such as obscuration
by intergalactic dust or evolution of supernovae of Type Ia
(cf. Leibundgut 2001).
The latter point regards primarily the absolute peak luminosity of
SNe Ia which might have changed between the local epoch and a
redshift of 1.0, especially in case of a decrease – the fainter
supernovae would not be a signature of larger distances, but rather
of an evolution of these objects.
Although present SN Ia models do not favor such an evolution, it
cannot be excluded, because neither the explosions nor the radiation
emerging from the atmosphere are, up to know, understood in detail.
Consequently, serious caveats for the cosmological interpretation of
distant supernovae exist.
Thus, we are faced with the question, are SNe Ia standard
candles independently of age, or is there some evolution of the SN
luminosity with age?
Among other things spectroscopy is certainly a powerful tool to obtain
an answer to this question by searching for spectral differences
between local and distant SNe Ia.
Unfortunately, there is at present not a clear picture about the
exact physical processes which take place in a SN Ia explosion
and how the radiation released from it should be treated in a proper
manner (for a recent review see Hillebrandt and Niemeyer 2000).
In order to get an impression about the basic physics involved that
affect the atmospheric structure of a SN Ia, a quick glance
at an observed spectrum will be helpful to point out the necessary
further steps for their analysis.
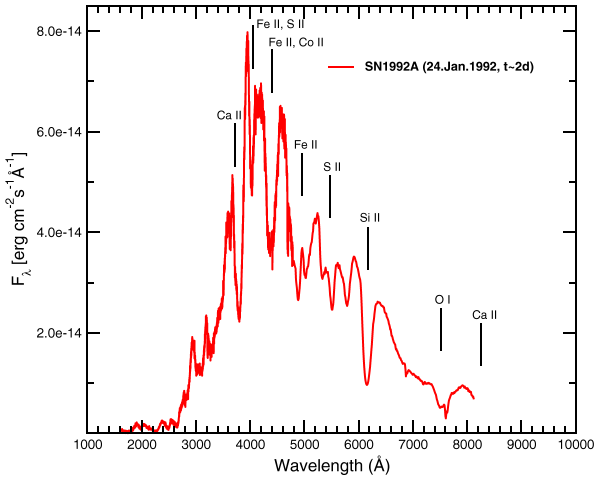
Figure 14 shows a typical SN Ia
spectrum at early epochs ( < 2 weeks after maximum).
The most striking features of this spectrum are the characteristic
P Cygni line profiles which are quite similar to the signatures
of O stars.
But compared to the latter objects there are also important
differences:
the broad lines indicate that the velocities of the SN Ia ejecta
are almost a factor of 10 larger, up to 30 000 km/s, and,
as a second important point, no H and no He lines are formed in the
case of the supernova.
Instead, prominent absorption features of mainly intermediate-mass
elements (Si II,
O I,
S II,
Ca II,
Mg II, ...)
embedded in a non-thermal pseudo-continuum are observed.
To answer the question of whether SN Ia are standard candles
in a cosmological sense, realistic models and synthetic spectra of
Type Ia Supernovae are obviously required for the analysis of
the observed spectra.
As just shown, however, these models will necessarily need to be
based on a similar serious approach for expanding atmospheres,
characterized by non-equilibrium thermodynamics, as is the case for
Hot Stars in general.
It will be shown in Section 7.1
that such spectra are in principle already available.
6. Concept for Consistent Models of Hot Star Atmospheres
In order to determine stellar abundances, parameters, and
physical properties (and from these, obtain realistic spectral energy
distributions) of Hot Stars via quantitative UV spectroscopy,
a principal difficulty needs to be overcome:
the diagnostic tools and techniques must be provided.
This requires the construction of detailed atmospheric models.
As has been demonstrated in the previous sections, such a tool
has not been obsoleted by general development in astrophysics; on
the contrary, it is becoming of ever greater relevance for current
astronomical research as spectral analysis of hot luminous stars is
of growing astrophysical interest.
Thus, continuing effort is expended to develop a standard code for
providing the necessary diagnostic tool.
In the following part of this section we describe the status of
our continuing work to construct realistic models for expanding
atmospheres.
Before we focus on the theory in its present stage, we should not
forget previous fundamental work which turned out to be essential in
elaborating the theory.
In this context I want to emphasize publications which regard key
aspects of theoretical activity.
The starting point of the development of the radiation-driven
wind theory is rooted in a paper by Milne (1926) more than 80
years ago.
Milne was the first to realize that radiation could be coupled to
ions and that this process subsequently may eject the ions from the
stellar surface.
The next fundamental step goes back to Sobolev (1957),
who developed the basic ideas of radiative transfer in expanding
atmospheres.
Radiation pressure as a driving mechanism for stellar outflow was
rediscovered by Lucy and Solomon (1970) who developed the basis
of the theory and the first attempt at its solution.
Beyond that, the pioneering step in the formulation of the theory
in a quasi self-consistent manner was performed by Castor, Abbott,
and Klein (1975).
Although these approaches where only qualitative due to many
simplifications, the theory was only developed further owing to the
promising results obtained by these authors.
Concerning key aspects of the solution of the radiative transfer
the work of Rybicki (1971) and Hummer and Rybicki (1985)
has to be emphasized.
With regard to the scenario for considering the soft X-ray emission
of O stars (detected by Seward et al. 1979 and
Harnden et al. 1979), Cassinelli and Olson (1979)
have investigated the possible influence of X-rays on the ionization
structure.
And Lucy and White (1980) and Owocki, Castor, and
Rybicki (1988) have have distinguished themselves with basic
theoretical investigations of time-dependent radiation hydrodynamics
which describe the creation and development of shocks (for more
details of the role of X-rays in the atmospheres of Hot Stars see
the reviews of Pauldrach et al. 1994b and Kudritzki and
Puls 2000).
6.1. The general method
The basis of our approach in constructing detailed atmospheric
models for Hot Stars is the concept of homogeneous, stationary,
and spherically symmetric radiation driven winds, where the
expansion of the atmosphere is due to scattering and absorption of
Doppler-shifted metal lines.
Although these approximations seem to be quite restrictive, it
has already been shown that the time-averaged mean of the observed
UV spectral features can be described correctly by such a method
(Pauldrach et al. 1994, 1994b).
The primary outcome of this kind of model calculation are the
spectral energy distributions and synthetic spectra emitted by the
atmospheres of hot stars.
As these spectra consist of hundreds of not only strong, but also weak
wind-contaminated spectral lines which form the basis of a quantitative
analysis, and as the spectral energy distribution from hot stars is
also used as input for the analysis of emission line spectra which
depend sensitively on the structure of the emergent stellar flux
(cf. Section 4), a sophisticated and well-tested method is
required to produce these data sets accurately.
However, developing such a method is not straightforward, since
modelling hot star atmospheres involves replicating a tightly
interwoven mesh of physical processes:
the equations of radiation hydrodynamics including the energy equation,
the statistical equilibrium for all important ions including the
atomic physics, and the radiative transfer equation at all transition
frequencies have to be solved simultaneously.
Figure 15 gives an overview of
the physics to be treated.
The principal features are:
-
The stellar parameters Teff (effective
temperature), logg (logarithm of photospheric gravitational
acceleration), R* (photospheric radius defined at
a Rosseland optical depth of 2/3) and Z (abundances) have to
be pre-specified.
-
The hydrodynamic equations are solved (r is the radial
coordinate, ρ the mass density, v the velocity, p the gas
pressure and Ṁ the mass loss rate).
The crucial term is the radiative acceleration grad,
which has minor contributions from continuous absorption, and major
contributions from scattering and line absorption.
For each line the oscillator strengths flu,
the statistical weights gl,
gu, and the occupation numbers
nl, nu of the lower
and upper level enter together with the frequency and angle integral
over the specific intensity Iν and the
line broadening function φν accounting
for the Doppler effect.
-
The occupation numbers are determined by the rate
equations containing collisional (Cij)
and radiative (Rij) transition rates.
Low-temperature dielectronic recombination is included and Auger
ionization due to K-shell absorption (essential for C, N, O, Ne, Mg,
Si, and S) of soft X-ray radiation arising from shock-heated matter is
taken into account using detailed atomic models for all important ions.
Note that the hydrodynamical equations are coupled directly with the
rate equations.
The velocity field enters into the radiative rates while the density
is important for the collisional rates and the equation of particle
conservation.
On the other hand, the occupation numbers are crucial for the
hydrodynamics since the radiative line acceleration dominates the
equation of motion.
-
The spherical transfer equation which yields the radiation
field at every depth point, including the thermalized layers where
the diffusion approximation is applied, is solved for the total
opacities (κν) and source functions
(Sν) of all important ions.
Hence, the influence of the spectral lines – the strong EUV
line blocking – which affects the ionizing flux that
determines the ionization and excitation of levels, is taken into
account.
Note that the radiation field is coupled with the
hydrodynamics (grad) and the rate equations
(Rij).
Moreover, the shock source functions
(SνS) produced by radiative cooling
zones which originate from a simulation of shock heated matter,
together with K-shell absorption
(κνK), are also included
in the radiative transfer.
The shock source function is incorporated on the basis of
an approximate calculation of the volume emission coefficient
(Λν) of the X-ray plasma in
dependence of the velocity-dependent post-shock temperatures and the
filling factor (f).
-
The temperature structure is determined by the microscopic
energy equation which, in principle, states that the
luminosity must be conserved.
Line blanketing effects which reflect the influence of line
blocking on the temperature structure are taken into account.
-
The iterative solution of the total system of equations yields
the hydrodynamic structure of the wind (i.e., the mass-loss
rate Ṁ and the velocity structure
v(r)) together with synthetic spectra and
ionizing fluxes.
Essential steps which form the basis of the theoretical framework
developed are described in Pauldrach et al. 1986,
Pauldrach 1987, Pauldrach and Herrero 1988, Puls and
Pauldrach 1990, Pauldrach et al. 1994, Feldmeier
et al. 1997, and Pauldrach et al. 1998.
The most complicating effect in the system is the overlap of the
spectral lines.
This effect is induced by the velocity field of the expanding
atmosphere which shifts at different radii up to 1000 spectral lines
of different ions into the line of sight at each observer’s
frequency.
Since the behavior of most of the UV spectral lines additionally
depends critically on a detailed and consistent description of
the corresponding effects of line blocking and line
blanketing (cf. Pauldrach 1987), special attention
has to be given to the correct treatment of the Doppler-shifted
line radiation transport of all metal lines in the entire sub- and
supersonically expanding atmosphere, the corresponding coupling with
the radiative rates in the rate equations, and the energy conservation.
Another important point to emphasize concerns the atomic data, since
it is quite obvious that the quality of the calculated spectra, the
multilevel NLTE treatment of the metal ions (from C to Zn),
and the adequate representation of line blocking and the radiative line
acceleration depends crucially on the quality of the atomic models.
Thus, the data have to be improved continuously whenever significant
progress of atomic data modelling is made.
Together with a revised inclusion of EUV and X-ray radiation produced
by cooling zones which originate from the simulation of shock heated
matter, these improvements have been implemented and described in a
recent paper (Pauldrach et al. 2001).
Very recently we have focused in addition on a remaining aspect
regarding hydrodynamical calculations which are consistent with
the radiation field obtained from the line-overlap computations and
incorporated this improvement into our procedure (see Pauldrach and
Hoffmann 2003).
This solution method is in its present stage already regarded as
a standard procedure towards a realistic description of stationary
wind models.
Thus, together with an easy-to-use interface and an installation
wizard, the program package WM-basic has been made available
to the community; download is possible from the URL given on the
first page.
In the next section it now has to be investigated thoroughly
whether these kind of models already lead to realistic results.
7. Synthetic Spectra and Models of Hot Star Atmospheres
The first five sections of this review inevitably lead to the
realization that line features of expanding atmospheres are one of the
most important astronomical manifestations, since they can easily be
identified even in spectra of medium resolution in individual objects
like supernovae or in integrated spectra of starburst regions even
at significant redshift.
As a consequence, they can be used to provide important information
about the chemical composition, the extragalactic distance scale,
and several other properties of miscellaneous stellar populations.
All that is required are hydrodynamic NLTE model atmospheres
that incorporate the effects of spherical extension and expansion as
realistic and consistent as possible.
After almost two decades of work these model atmospheres now seem to be
available, and in the following we will investigate thoroughly whether
basic steps towards realistic synthetic spectra for Supernovae of
Type Ia can already be presented, and whether UV diagnostic
techniques applied to two of the most luminous O supergiants
in the Galaxy lead to synthetic spectra which can be regarded as a
measure of excellent quality.
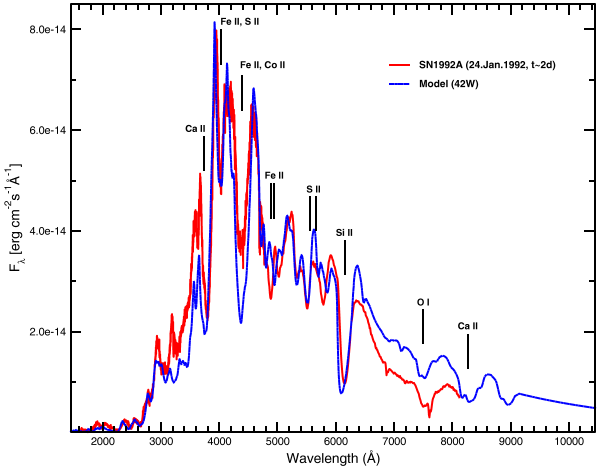
7.1. Synthetic and Observed Spectra of Supernovae of Type Ia
Prominent features in the spectra of Type Ia supernovae
in early phases are characteristic absorption lines resulting
from low ionized intermediate-mass elements (such as
Si II,
O I,
Ca II,
Mg II,
cf. Figure 17).
These absorption lines show characteristic line shapes due to
Doppler-broadening resulting from the large velocity gradients and
the formation of these lines results in a pseudo-continuum that is
set up by the enormous number of these lines.
Supernovae appear in this ‘photospheric’ epoch for about
one month after explosion and the spectra at this epoch contain useful
information on the energetics of the explosion (luminosity, velocity-
and density-structure) and on the nucleosynthesis in the intermediate
and outer part of the progenitor star.
The primary objective, in order to analyze the spectra, therefore
is to construct consistent models which link the results of the
nucleosynthesis and hydrodynamics obtained from state-of-the-art
explosion models (cf. Reinecke et al. 1999) with the
calculations of light curves and synthetic spectra of SN Ia.
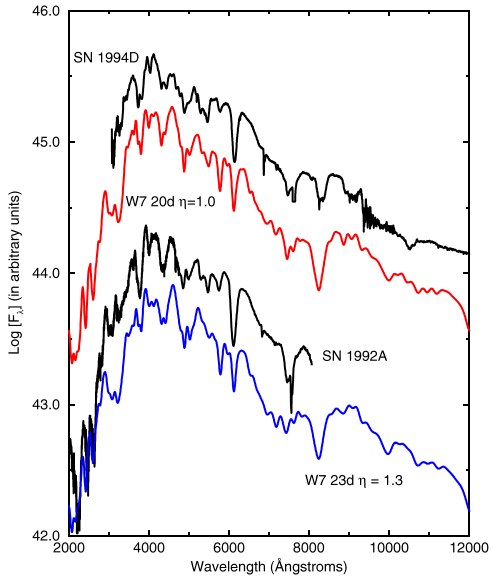
In a fist step, however, this is done by using the standard
hydrodynamical model W7 by Nomoto et al. 1984, and
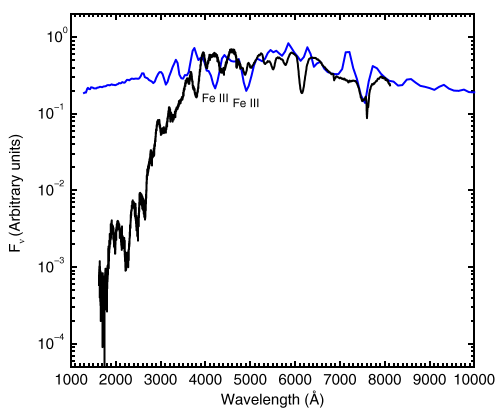
Figure 16 exemplifies the
status quo of the synthetic Spectra of Type Ia Supernovae at early
phases obtained from this first step, compared to observations.
The first comparison shown (top left panel of
Figure 16) is obviously not
at all the outcome of a realistic atmospheric model.
The synthetic spectrum shown has been obtained for a model without
line blocking, i.e., only continuum opacity has been considered in
the NLTE calculation.
Thus, the drastic effects of line blocking on the ionization and
excitation and the emergent flux can be verified by comparing the
calculated flux with the observed flux also shown – the huge
difference observed in the UV is due to the missing contribution of
the lines to the opacity.
It is an essential by-product of this result that the observed line
features in the optical are also not reproduced:
the two strongest features in the synthetic spectrum are due to
Fe III lines, and this indicates that
the ionization is too high because of the excessive UV flux.
This behavior nicely illustrates that the ionization balance depends
almost entirely on the ionizing UV flux and that this influence can be
traced by the spectral lines in the observable part of the spectrum,
as has been stated in Section 4.2.
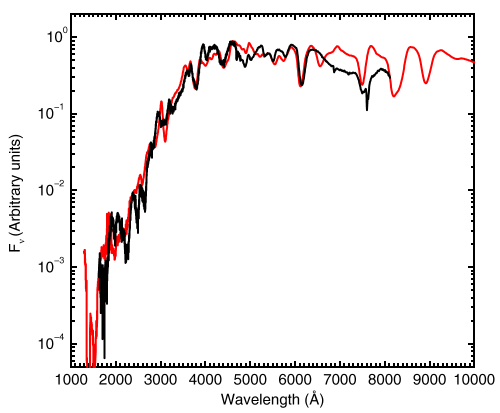
That the difference in the UV observed for this model is indeed
due to line blocking becomes obvious if this important effect is
properly taken into account, as is the case for model shown in the
upper right panel of Figure 16.
The agreement of the resulting spectrum of this model with the
observations is quite good, demonstrating that line blocking alone
can diminish the discrepancy between the synthetic and the observed
spectra.
Both the flux level and most line features are now reasonably
well reproduced throughout the spectrum (cf. Pauldrach
et al. 1996).
Additionally, Figure 16
shows in the lower left panel a spectral fit to the same supernova
observation by Nugent et al. (1997) which is based on a
completely independent approach to the theory.
As is shown, the resulting spectrum is also quite reasonable.
Finally, Figure 17 shows a
recently calculated synthetic spectrum that is based on the important
improvements to the theory described in the previous section,
compared to the observed “standard” supernova spectrum
(SN 1992A).
As is shown, the synthetic spectrum reproduces the observed spectrum
quite well, and the overall impression of this comparison is that
the method used is already on a quantitative level, indicating
that the basic physics are treated properly (cf. Sauer and
Pauldrach 2002).
Although there is still need for improvements regarding, for
instance, a proper treatment of the γ energy
deposition in the outermost layers and the use of current hydrodynamic
explosion models, the basis for the primary objective of the subject,
to search for spectral differences between local and distant SNe Ia,
is formed.
Concerning the facilities of spectral analysis we are thus close to
the point where we can tackle the question of whether SNe Ia
are standard candles in a cosmological sense.
7.2. Detailed Analyses of Massive O Stars
The objectives of a detailed comparison of synthetic and observed
UV spectra of massive O stars are manifold.
Primarily it has to be verified that the higher level of consistent
description of the theoretical concept of the effects of line blocking
and blanketing and the involved modifications to the models leads to
changes in the line spectra with much better agreement to the observed
spectra than the previous, less elaborated and less consistent models.
Secondly it has to be shown that the stellar parameters, the wind
parameters, and the abundances can be determined diagnostically via a
comparison of observed and calculated high-resolution spectra covering
the observable UV region.
And finally, the quality of the spectral energy distributions has to
be verified.
As was illustrated in Section 4.2 the latter point is, however,
a direct by-product of the other objectives in case the complete
observed high-resolution UV spectra are accurately reproduced
by the synthetic ones.
In the following, the potential of the improved method will
be demonstrated by an application to the O4 I(f)
star ζ Puppis and the O9.5 Ia star
α Cam.
7.2.1. UV Analysis of the Hot O Supergiant
ζ Puppis
At this point we return to the beginning, as we now start to examine
carefully the old-fashioned UV spectrum of ζ Puppis.
But before we do that, we will first briefly review the improvements
of UV line fits which followed from stepwise improvements of
the methods used.
The first serious attempt to analyze the UV spectrum of this
standard object goes back to Lamers and Morton in 1976.
From a present point of view their model can not be regarded as a
sophisticated one, because they assumed the complete model structure
– the dynamical structure, the occupation numbers, and the
temperature structure – and the line radiative transfer was
treated in an approximative way.
What we learned nevertheless from this kind of spectrum synthesis
was that a solution to the problem is feasible, and that at
least the dynamical parameters – the mass-loss rate
(Ṁ) and the terminal velocity
(v∞) – can in principle be determined
from UV lines quite accurately.
The UV line fits of Hamann in 1980 have been based on the
same assumptions apart from a very detailed treatment of the the line
radiative transfer, and as a result of this the calculated resonance
lines of some ions were already quite well in agreement with the
observed ones.
But the obvious conclusion from these comparisons was that a more
consistent treatment of expanding atmospheres is required for a
detailed analysis.
The situation improved considerably with the first attempts at a
consistent solution, meaning that the equations of hydrodynamics,
non-equilibrium thermodynamics, and radiative transfer have been
solved in a consistent way.
Pauldrach (1987) introduced for the first time a full NLTE
treatment of the metal lines driving the wind into his consistent
method, and Puls (1987) investigated the important effect of
multiple photon momentum transfer through line overlaps caused by
the velocity-induced Doppler-shifts for applications in stellar
wind dynamics.
The outcome of this procedure have already been dynamical parameters,
constraints on the stellar parameters, and as has been verified by a
comparison of a sample of calculated spectral lines with the observed
spectrum, an ionization equilibrium and occupation numbers which were
close to a correct description.
But, among other approximations the models still suffered from the
neglect of radiation emitted from shock cooling zones and a very
approximate treatment of line blocking.
After this step it turned out to be a long road to reproduce most
of the important observed individual line features in the UV.
This required a lot of effort in atomic physics, in improved NLTE
multilevel radiative transfer, and in spectrum synthesis techniques.
An important step towards this objective was the paper by Pauldrach
et al. (1994), where for the first time stellar parameters
and abundances have been determined from individual UV line features.
Figure 18 shows the
corresponding synthetic spectrum that was already in overall agreement
with the observations.
Nevertheless, the treatment was still affected by a number of severe
approximations regarding especially the neglect of the line blanketing
effect, an approximate treatment of the line radiative transfer,
and a simple treatment of emitted radiation from shock cooling zones.
Thus, the conclusion remained that a more consistent treatment of
expanding atmospheres was required for a detailed analysis.
This more consistent treatment of expanding atmospheres which
fixes the status quo has now been applied in a final step and is
based on the improvements discussed in Section 6.1 (for a more
comprehensive discussion see Pauldrach et al. 2001 and
Pauldrach and Hoffmann 2003).
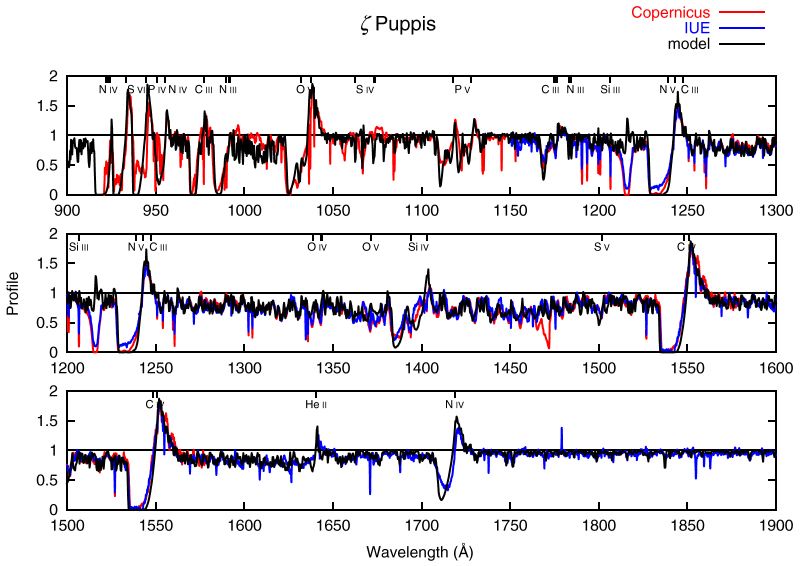
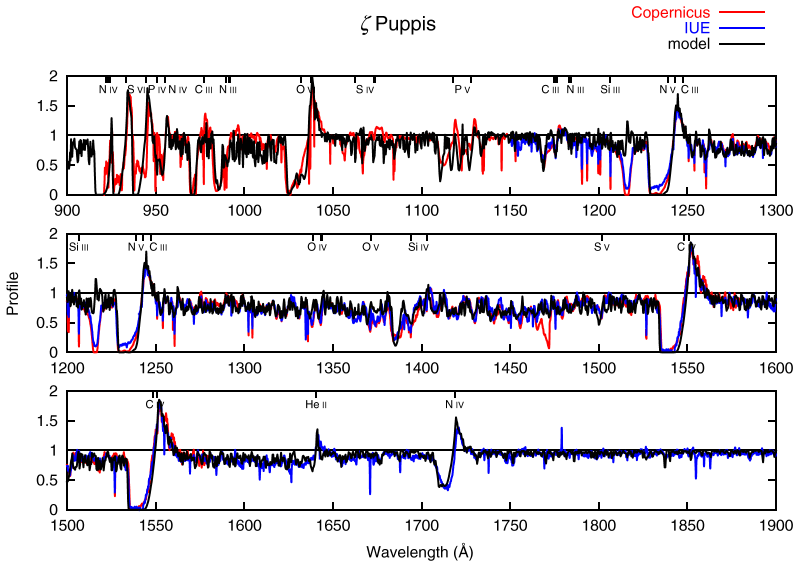
As is shown in Figure 19
the calculated synthetic spectrum is quite well in agreement with
the IUE and the Copernicus observed spectra.
The small differences observed for the
Si IV and the
N IV lines in the upper panel just
reflect a sensitive behavior on the parameters used to describe the
shock distribution.
This is verified in the lower panel of
Figure 19 by another
comparison, where just the shock-distribution has been changed slightly
within the range of uncertainty of the corresponding parameters.
Moreover, the stellar and wind parameters of this object are confirmed
by the model on which the synthetic spectrum is based, and the
abundances of C, N, O, P, Si, S, Fe, and Ni have been determined.
We therefore conclude that the present method of quantitative spectral
UV analysis of Hot Stars leads to models which indeed can be
regarded as being realistic.
Consequently, we regard these kind of quantitative spectral
UV analyses as the ultimate test for the accuracy and the
quality of theoretical ionizing fluxes
(cf. Figure 20), which
thus can be used as spectral energy distributions for the analysis
of H II regions.
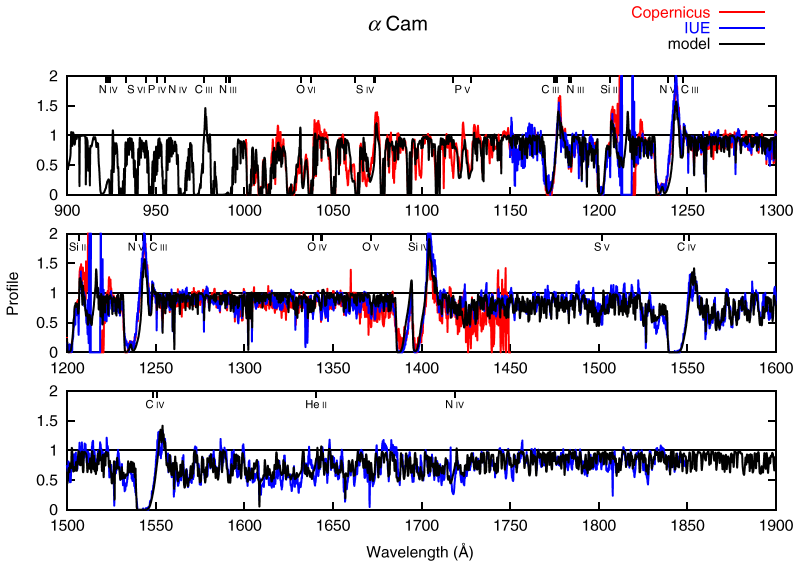
7.2.2. UV Analysis of the Cool O Supergiant
α Cam
That the method also works for cool O supergiants
like α Cam is shown in
Figure 21.
We recognize again that the synthetic spectrum is quite well in
agreement with the IUE and the Copernicus observed spectra (for a
discussion see Pauldrach et al. 2001).
In the uppermost panel of the spectrum simulations of interstellar
lines have additionally been merged with the synthetic spectrum
in order to disentangle wind lines from interstellar lines (for a
discussion of this point see Hoffmann 2002).
Moreover, our new realistic models applied to this object along with
UV spectrum synthesis techniques allowed also in this case to
determine stellar parameters, wind parameters, and abundances from
the UV spectra alone.
(The operational procedure of the method begins with realistic
estimates of R, Teff, M, and a set
of abundances, with which the model atmosphere is solved and the
velocity field, the mass loss rate Ṁ, and the synthetic
spectrum is calculated.
The parameters are adjusted and the process is repeated until a good
fit to all features in the observed UV spectrum is obtained.
For a compact description of this procedure see Pauldrach
et al. 2002).
It turned out that the effective temperature can be determined to
within a range of ±1000 K and the abundances to at least
within a factor of 2.
7.3. Wind properties of massive O stars
As a last point we want to illustrate the significance of the
dynamical parameters of radiation-driven winds.
The intrinsic significance is quite obvious, because it is the
consistent hydrodynamics which provides the link between the stellar
parameters (Teff, M, R) and the
wind parameters (v∞, Ṁ),
and the appearance of the UV spectrum is thus determined by the
interplay of the NLTE model and the hydrodynamics (as was discussed
in Section 6.1, the hydrodynamics is controlled by the line
force which is primarily determined by the occupation numbers and the
radiative transfer of the NLTE model, but the hydrodynamics affects
in turn the NLTE model via the density and velocity structure).
In a first step, the tool for illustrating the significance
of the dynamical parameters is offered by the so called
wind-momentum-luminosity relation.
This relation is based on two important facts:
The first one is that, due to the driving mechanism of hot stars,
the mechanical momentum of the wind flow
(v∞Ṁ) is mostly a function of
photon momentum (L/c) and is therefore related to
the luminosity.
The second one is that the expression
v∞ṀR1/2
is an almost directly observable quantity.
As the shapes of the spectral lines are characterized by the strength
and the velocity of the outflow, the first term of this expression,
the observed terminal velocity, can be measured directly from the
width of the absorption part of the saturated UV resonance lines.
It is already a bit more complex to deduce the value of the mass-loss
rate from the line profiles, since this requires the calculation of
the ionization balance in advance, but the advantage is that it can
already be done on the basis of optical lines like Hα.
Thus, the product of the last two terms of the expression
v∞ṀR1/2
follows directly from a line fit of Hα
(cf. Puls et al. 1996).
The dynamical parameters obtained in this way are usually designated
as observed wind parameters.
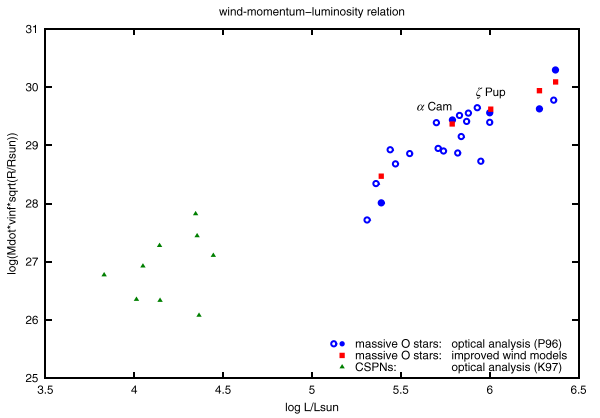
Figure 22 shows that the wind momentum
luminosity relation indeed exists for massive O stars, since
the linear relation predicted by the theory, in first approximation
and for fixed metallicities, is followed by massive hot stars.
With regard to the spread around the expected theoretical
wind-momentum-luminosity relation of the Central Stars of
Planetary Nebulae within the lower part of the diagram of
Figure 22 obtained by Kudritzki
et al. (1997), Pauldrach et al. (2002, 2003)
gave a solution which, however, will not be believed by the part of
the community which is familiar with stellar evolution, at least for
a couple of years.
Moreover, it is important to note that as a by-product of
this relation it can be used as an independent tool for measuring
extragalactic distances up to Virgo and Fornax, since it is independent
of the observationally unknown masses (for a recent and comprehensive
review on this subject see Kudritzki and Puls 2000).
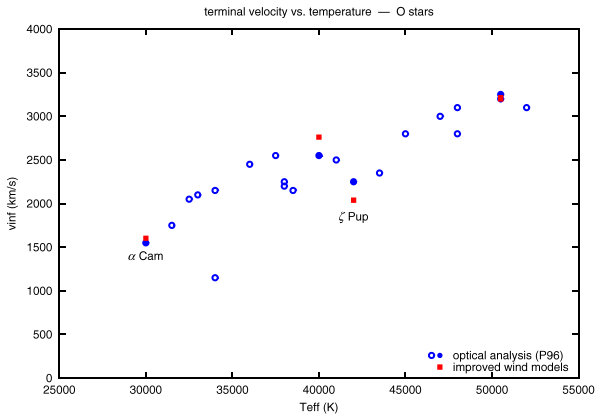
Figure 23 shows that the
observed behavior of the wind momentum luminosity relation is
represented quite well by our improved realistic models; this
regards in particular the two supergiants (ζ Puppis
and α Cam) analyzed in Section 7.2.
But, as was pointed out just above, this relation is independent of
the stellar mass.
Thus, in order to verify the statement of the previous section that
the observed stellar and wind parameters are confirmed by the present
models, we also have to investigate the relations of the individual
dynamical parameters.
For this investigation the same stellar parameters as have been
used to obtain the observed wind parameters must be used as input
for our models.
On basis of this requirement
Figure 24 shows in the upper
panel that the observed and predicted values of the terminal velocities
(v∞) are in agreement within 10%.
Since v∞ is proportional to the escape velocity
(vesc),
|
v∞ ∝ vesc = |
⎛
⎜
⎝ |
2GM
R |
(1 − Γ) |
⎞
⎟
⎠ |
1/2
|
|
which strongly depends on the mass of the objects, the mass is
thus determined very accurately by the predicted values (G
is the gravitational constant and Γ is the ratio of
radiative Thomson to gravitational acceleration).
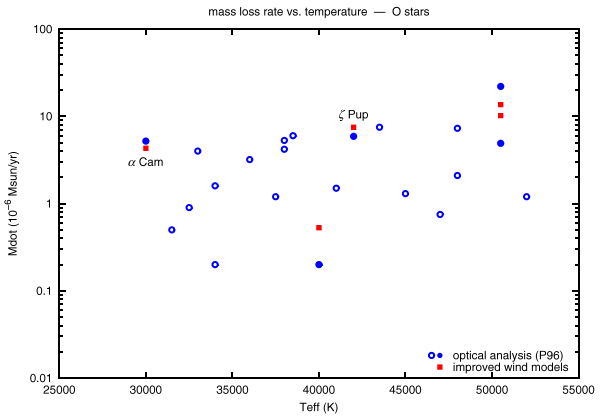
Concerning the mass-loss rates we found agreement within a factor of
two as is shown in Figure 24
lower panel.
Due to the strong relation between the mass-loss rates and the
luminosities (Ṁ ∝ L) the
luminosities thus can be determined precisely.
Computing the wind dynamics consistently with the NLTE model
therefore permits not only the determination of the wind parameters
from given stellar parameters, but conversely makes it possible to
obtain the stellar parameters just from the observed UV spectrum
alone.
As stated above, this means that in principle the stellar
parameters can immediately be read off simply by comparing an observed
UV spectrum to a proper synthetic spectrum.
This, however, is not always really simple, since in most cases a
comprehensive grid of models and some experience will be required to
do so.
Although this idea is not new (cf. Pauldrach et al. 1988
and Kudritzki et al. 1992), only this new generation of models
has reached the degree of sophistication that makes such a procedure
practicable instead of purely academic.
The corresponding conclusion is that realistic models are
characterized by at least a quantitative spectral UV analysis
calculated along with a consistent dynamics.
8. Conclusions and Outlook
The need for detailed atmospheric models of Hot
Stars has been motivated in depth and a diagnostic tool
with great astrophysical potential has been presented.
It has been shown that the models of the new generation are
realistic.
They are realistic with regard to a quantitative spectral
UV analysis calculated, for the case of O stars, along with
consistent dynamics, which, in principle, allows to read off the
stellar parameters simply by comparing an observed UV spectrum
to a suitable synthetic spectrum.
The new generation of models has reached a degree of sophistication
that makes such a procedure practicable.
The astronomical perspectives are enormous.
Of course, there is still a large amount of hard and careful
astronomical work that needs to be done.
The diagnostic tool for expanding model atmospheres is in our hands,
but this is (as usual) just the starting point; further elaboration,
refinements, and modifications are required before the results are
quantitatively completely reliable.
However, this is not the handicap for the future.
The present handicap are future observations.
What is most urgently needed is the Next Generation Space
Telescope.
With respect to the topics discussed in this review it is needed
for a variety of reasons:
To tackle the question whether Supernovae Ia are
standard candles in a cosmological sense realistic models and synthetic
spectra of Type Ia Supernovae require spectral observations
of objects at mid-redshift and sufficient resolution.
The context of this question regards the current surprising result
that distant SNe Ia at intermediate redshift appear fainter than
standard candles in an empty Friedmann model.
Consequently, the SN-luminosity distances indicate accelerated
expansion of the universe.
In order to be able to make quantitative predictions
about the influence of very massive, extremely metal-poor
Population III stars on their galactic and intergalactic
environment one primarily needs observations which can be compared
with the predicted flux spectrum already available for zero metallicity
and principally producible for metallicities different from zero.
Observations with the Next Generation Space Telescope (NGST) of distant
stellar populations at high redshifts will principally give us the
opportunity to deduce the primordial IMF from these comparisons, and
thus allow to investigate quantitatively the ionization efficiency
of a Top-heavy IMF via realistic spectral energy distributions
of these very massive stars.
NGST observations are further important for determining
extragalactic abundances and population histories of starburst
galaxies from an analysis of
H II regions.
This task also requires energy distributions of time-evolving stellar
clusters, which are calculated on basis of a grid of spectral
energy distributions of O and early B-type stars.
A crucial point with respect to this is whether the spectral energy
distributions of massive stars are already realistic enough to be
used for diagnostic issues of
H II regions.
It has been shown in this review that the ultimate test is
provided by a comparison of observed and synthetic UV spectra of
individual massive stars, since the ionization balance can be traced
reliably through the strength and structure of the wind lines formed
throughout the atmosphere.
NGST is also important for exploiting the diagnostic perspectives
of galaxies with pronounced current star formation directly.
It has been demonstrated that massive stars dominate the UV wavelength
range in star-forming galaxies, and that therefore the
UV-spectral features of massive O stars can be used as tracers
of age and chemical composition of starburst galaxies even at high
redshift.
This is in particular the case when the flux from these galaxies
is amplified by gravitational lensing through foreground galaxy
clusters; corresponding observations render the possibility of
determining metallicities of starbursting galaxies in the early
universe via realistic UV spectra (in the rest frame)
of massive O stars.
As a final remark it is noted that the solution method of stationary
models for expanding atmospheres is in its present stage already
regarded as a standard procedure towards a realistic description.
Thus, together with an easy-to-use interface and an installation
wizard, the program package WM-basic has been made available
to the community; download is possible from the URL given on the
first page.
Acknowledgments
I wish to thank my colleague Tadziu Hoffmann for carefully reading the manuscript, and I am grateful to Amiel
Sternberg and Claus Leitherer for providing me with figures from their publications. This research was supported
by the Sonderforschungsbereich 375 of the Deutsche Forschungsgemeinschaft, and by the German-Israeli Foundation
under grant I-551-186.07/97.
References
Baldwin, J.A., Ferland, G.J., Martin, P.G. et al., 1991, ApJ, 374, 580
Bromm, V., Coppi, P. S., Larson, R. B. 1999, ApJ 527, L5
Bromm, V., Kudritzki, R.P., Loeb, A., 2001, ApJ 552, 464
Carr, B.J., Bond, J.R., Arnett, W.D. 1984, ApJ 277, 445
Cassinelli, J., Olson, G., 1979, ApJ 229, 304
Castor J.I., Abbott D.C., Klein R., 1975, ApJ 195, 157
Conti, P.S., Leitherer, C., Vacca, W.D., 1996, ApJ 461, L87
El Eid, M.F., Fricke, K.J., Ober, W.W., 1983, A&A 119, 54
Fan, X. et al., 2000, AJ 120, 1167
Feldmeier, A., Kudritzki, R.-P., Palsa, R., Pauldrach, A. W. A., Puls, J., 1997, A&A 320, 899
Genzel, R. et al., 1998, ApJ 498, 579
Giveon, U., Sternberg, A., Lutz, D., Feuchtgruber, H., Pauldrach, A. W. A., 2002, ApJ 566, 880
Gunn, J. E., Peterson, B. A. 1965, ApJ 142, 1633
Hamann, W.R., 1980, A&A 84,342
Harnden F.R., Branduardi G., Elvis M. et al., 1979, ApJ 234, L51
Hillebrandt, W., Niemeyer, J. C., 2000, ARA&A, 38, 191
Hoffmann, T. L., 2002, Ph.D. thesis, LMU Munich
Hoffmann, T. L., Pauldrach, A. W. A., 2002, IAU Symposium 209, in press
Hummer, D.G., Rybicki, G.B., 1985, ApJ 293, 258
Kirshner, R.P., Jeffery, D.J., Leibundgut, B., et al., 1993, ApJ 415, 589
Kudritzki R.P., Hummer D. G., Pauldrach A. W. A. et al., 1992, A&A 257, 655
Kudritzki R.P., Méndez R. H., Puls J., McCarthy, J. K., 1997, in IAU Symp. 180, Planetary Nebulae, eds. H. J. Habing & H. J. G. L. M. Lamers, p. 64
Kudritzki, R.P., Puls, J., 2000, ARA&A 38, 613
Kudritzki, R.P., 2002, ApJ in press
Kunth, D., Mas-Hesse, J.M., Terlevich, R., et al., 1998, A&A 334, 11
Kurucz, R.L., 1992, Rev. Mex. Astron. Astrof. 23, 181
Lamers, H.J.G.L.M., Morton, D.C., 1976, ApJ S. 32, 715
Larson, R. B., 1998, MNRAS 301, 569
Leibundgut, B., 2001, ARA&A, 39, 67
Leitherer, C., Leão, J., Heckman, T. M., Lennon, D. J., Pettini, M., Robert, C., 2001, ApJ 550, 724
Lucy L.B., Solomon P., 1970, ApJ 159, 879
Lucy L.B., White,R., 1980, ApJ 241, 300
Lutz, D., et al., 1996, A&A 315, 137
Loeb, A. 1998, in ASP Conf. Ser. 133, 73
Milne E.A., 1926, MNRAS 86, 459
Morton, D. C., Underhill, A. B., 1977, ApJ Suppl., 33, 83
Nomoto, K., Thielemann, F.-K., Yokoi, K., 1984, ApJ 286, 644
Nugent, P., Baron, E., Branch, D., et al., 1997, ApJ 485, 812
Oey M.S., Massey P., 1995, ApJ 452, 210
Owocki S., Castor, J., Rybicki, G., 1988, ApJ 335, 914
Pauldrach, A. W. A., Puls, J., Kudritzki, R.P.,1986, A&A 164, 86
Pauldrach, A. W. A., 1987, A&A 183, 295
Pauldrach, A. W. A., Herrero, A., 1988, A&A 199, 262
Pauldrach A. W. A., Puls J., Kudritzki R.-P. et al., 1988, A&A 207, 123
Pauldrach, A. W. A., Feldmeier, A., Puls, J., Kudritzki, R.-P., 1994b, Space Science Reviews 66, 105
Pauldrach, A. W. A., Kudritzki, R.-P., Puls, J. et al., 1994, A&A 283, 525
Pauldrach, A. W. A., Duschinger, M., Mazzali, P. A. et al., 1996, A&A 312, 525
Pauldrach, A. W. A., Lennon, M., Hoffmann, T. L. et al., 1998, in: Proc. 2nd Boulder-Munich Workshop, PASPC 131, 258
Pauldrach, A. W. A., Hoffmann, T. L., Lennon, M., 2001, A&A 375, 161
Pauldrach, A. W. A., Hoffmann, T. L., Mendez, R.H., 2002, IAU Symposium 209, in press
Pauldrach, A. W. A., Hoffmann, T. L., Mendez, R.H., 2003, A&A in press
Pauldrach, A. W. A., Hoffmann, T. L., 2003, A&A in press
Perlmutter, S., Aldering, G., Goldhaber, G. et al., 1999, ApJ 517, 565
Pettini, M., Kellogg, M., Steidel, C.C., et al., 1998, ApJ 508, 539
Pettini, M., Steidel, C.C., Adelberger, K.L., Dickinson, M., Giavalisco, M., 2000, ApJ 528, 96
Puls, J., 1987, A&A, 184, 227
Puls, J., Pauldrach, A. W. A., 1990, PASPC 7, 203
Puls J., Kudritzki R.-P., Herrero A., Pauldrach, A. W. A., Haser, S.M. et al., 1996, A&A 305, 171
Reinecke, M., Hillebrandt, W., Niemeyer, J.C., 1999, A&A 374, 739
Riess, A.G., Filippenko, A.V., Challis, P., et al. 1998. Astron. J. 116, 1009
Riess, A.G., Kirshner, R.P., Schmidt, B.P., et al., 1999, Astron. J. 117, 707
Rybicki, G.B., 1971, JQSRT 11, 589
Rubin, R.H., Simpson, J.P., Haas, M.R. et al., 1991, PASP 103, 834
Saha, A., Sandage, A., Thim, F., Labhardt, L., Tammann, G. A., Christensen, L., Panagia, N., Macchetto, F., 2001, ApJ, 551, 973
Sauer, D., Pauldrach, A. W. A., 2002, Nuclear Astrophysics, MPA/P13
Seward, F.D., Forman, W.R., Giacconi, R. et al., 1979, ApJ 234, L55
Schaerer, D., de Koter, A., 1997, A&A 322, 598
Sellmaier, F.H., Yamamoto, T., Pauldrach, A. W. A., Rubin, R.H., 1996, A&A, 305, L37
Simpson, J.P., Colgan, S.W.J., Rubin, R.H. et al., 1995, ApJ 444, 721
Sobolev V., 1957, Sov. A&A J. 1, 678
Steidel, C.C., Giavalisco, M., Pettini, M., Dickinson, M., Adelberger, K.L., 1996, ApJ 462, L17
Sternberg, A., Hoffmann T. L., Pauldrach A. W. A., 2002, ApJ in press
Thornley, M.D., Förster-Schreiber, N.M., Lutz, D. et al., 2000, ApJ 539, 641
Walborn, N. R., Nichols-Bohlin, J., Panek, R. J., 1985, IUE Atlas of O-Type Spectra from 1200 to 1900Å (NASA RP-1155)