All hot stars have winds driven by radiation. These winds become directly observable in spectral energy distributions and spectral lines as soon as the stars are above certain luminosity borderlines in the HRD. For massive stars of spectral type O, B, and A the borderline corresponds to 104 Lsun. Above this threshold in luminosity all massive stars show direct spectroscopic evidence of winds throughout their lifetime (Abbott 1979). An analogous threshold exists for stars of intermediate and low mass (MZAMS £ 8 Msun), when they evolve through the post-AGB phases towards the White Dwarf final stage. Here, all objects more massive than 0.58 Msun or more luminous than 103.6 Lsun exhibit direct signatures of winds in their spectra (Pauldrach et al 1989).
Winds are able to modify the ionizing radiation of hot stars dramatically (see Gabler et al 1989, 1991 and 1992, Najarro et al 1996). Their momenta and energies contribute substantially to the dynamics and energetics of the ambient interstellar medium in galaxies or of surrounding gaseous nebulae. Even weak winds (i.e., those with no direct spectroscopic evidence of mass-outflow) may produce thin gaseous envelopes around stars before they become red supergiants with dense slow winds or explode as supernovae in later stages of their evolution. The gas-dynamical interaction of stellar plasmas streaming with different velocities and densities will then eventually lead to complex surrounding structures directly observable with high spatial resolution. In binary systems winds can be partially accreted or can produce shocks of colliding winds resulting in X-ray emission in both cases. Winds affect the physics of stellar atmospheres by dominating the density stratification and the radiative transfer through the presence of their macroscopic transonic velocity fields, they substantially influence the evolution of stars by modifying evolutionary time-scales, chemical profiles, surface abundances and stellar luminosities and they are vital for the evolution of galaxies by their input of energy, momentum and nuclear processed material to the ISM.
In addition, stellar winds are a gift of nature allowing quantitative spectroscopic studies of the most luminous stellar objects in distant galaxies and, thus, enabling us to obtain important quantitative information about their host galaxies. Broad stellar wind lines can be identified in spectra integrating over the stellar populations of extremely distant galaxies at high redshift even when the spectral resolution and the signal-to-noise ratio are only moderate (Steidel et al 1996). Particularly in cases when the flux from these galaxies is amplified by gravitational lensing through foreground galaxy clusters, stellar wind lines can be used to estimate metallicities of starbursting galaxies in the early universe (Pettini et al 1999). In the local universe, the population synthesis of spectroscopic stellar wind features observed in the integrated light of starbursting regions of galaxies can yield important information about the population of stars formed (Leitherer 1998, Leitherer et al 1999). Finally, the observation of winds of isolated blue supergiants as individuals in spiral and irregular galaxies provides an independent new tool for the determination of extragalactic distances by means of the Wind Momentum - Luminosity Relationship (Kudritzki, Lennon, Puls 1995; Puls et al 1996; Kudritzki 1998; Kudritzki et al 1999).
In view of the important rôle of winds from hot stars in so many areas of astrophysics it is not surprising that the number of papers and conferences dealing with them is enormous. As a result, a complete review covering all aspects in theory and observation is impossible within the framework of this review series and a restriction of the subject is needed. Therefore, we have decided to restrict this review to the discussion of winds from ``normal'' hot stars in well established evolutionary stages such as dwarfs, giants and supergiants. We will not discuss objects with extreme winds such as Wolf-Rayet stars, Luminous Blue Variables in outburst, Be-stars etc. We are aware of the fact that by this restriction a significant amount of active research in very interesting areas of stellar physics will be omitted. On the other hand, it will allow us to cover the most fundamental stages of stellar evolution in sufficient depth.
The goal of this review is to inform about the advanced diagnostic methods of stellar winds including an assessment of the accuracy of the determinations of global stellar wind properties such as terminal velocities, mass-loss rates, wind momenta and wind energies (Sect. 2). Simple empirical scaling relations of these stellar wind properties as a function of stellar parameters will be provided (Sect. 3) and will be interpreted in the framework of the stationary, one-dimensional theory of radiation driven winds (Sect. 4). The influence of systematic effects caused by non-homogeneous structures, time-dependence and deviations from spherical symmetry caused by rotation will be discussed (Sect. 4 and 5). The review will be finished with a brief discussion of stellar wind lines as extragalactic distance indicators and as tracers of chemical composition of galaxies at high redshift, in particular in view of the potential of the new generation of very large ground-based telescopes (Sect. 6).
Winds of hot stars are characterized by two global parameters, the terminal velocity v¥ and the rate of mass-loss Mdot. Since these winds are initiated and then continuously accelerated by the absorption of photospheric photons in spectral lines, the velocity v¥ reached at very large distances from the star, where the radiative acceleration approaches zero because of the geometrical dilution of the photospheric radiation field, corresponds to the maximum velocity of the stellar wind. If we assume that winds are stationary and spherically symmetric, then the equation of continuity yields at any radial coordinate R in the wind
|
(1) |
From Eq. 1 it is evident that the average mass density rbar (Eq. 2 with R* the photosperic radius) is another global parameter related to the observability of stellar winds. For instance, the optical depths of a metal resonance line (with a line absorption coefficient µ r(R)) or a recombination line such as Ha (with a line absorption coefficient µ r2(R)) are proportional to Qres and Q2, respectively, defined as
|
(2) |
It is important to realize that the determination of stellar wind properties from observed spectra is never straightforward and simple. Global stellar wind parameters as defined in the previous subsection are no direct observables. Their determination relies on stellar atmosphere models including the hydrodynamic effects of winds, which form the basis for radiative transfer calculations to be compared with the observations. In other words, whenever we discuss ``observations of stellar winds'' we must be aware of the fact that those observed stellar wind properties are already the result of diagnostic techniques based on a substantial amount of theoretical modeling. Depending on the degree of sophistication of the underlying model but also depending on the fact which part of the spectrum is used for the determination of which stellar wind quantity, the reliability of the results obtained can be vastly different.
A few examples may illustrate this point. The determination of the mass-loss rate Mdot from a significant ``thermal'' radio excess in the spectral energy distribution (for details, see discussion in the corresponding subsection) caused by the Bremsstrahlung of the stellar wind envelope requires only a very simple analytical stellar wind model and radiative transfer calculation, because the thermal free-free and bound-free emission of a plasma is such a simple process as long as the wind is homogeneous, not clumpy, spherically symmetric and stationary. Mass-loss rates obtained in this way are usually regarded as sufficiently accurate. However, even such reliable ``observations'' may be severely affected in a systematic way as soon as winds are clumpy and deviate from spherical symmetry.
In such a situation an alternative would be the analysis of the P-Cygni profiles of UV metal resonance lines. One can show that for these lines the influence of inhomogeneity and clumpiness is less important (see Sect. 5). However, to deduce Mdot one needs an accurate estimate of the element abundance and the degree of ionization of the ion producing the analyzed P-Cygni line. In particular for the latter, a tremendous effort in terms non-LTE multi-level and multi-line atmospheric modeling is necessary to obtain results (see Pauldrach et al 1994 and 1998, Taresch et al 1997, Haser et al 1998), which are still affected by open questions such as the contribution of ionizing radiation from shocks embedded in the stellar wind flow. In consequence, mass-loss rates determined in this way are usually regarded as less reliable.
A discussion of observed global stellar wind parameters, therefore, requires a strategy concerning the underlying atmospheric models used for the diagnostics. On the one hand, for the analysis methods applied the models have to be sophisticated enough so that the results appear to be reliable, on the other, the models have to be simple enough so that a large number of objects can be analyzed and discussed differentially in a parameter space of reasonable dimensions.
As a result of this consideration, the ``standard model'' for stellar wind diagnostics is rather simple. A stationary, spherically symmetric smooth stellar wind obeying the equation of continuity (Eq. 1) is adopted with a velocity field in the supersonic region of the wind of the form
|
(3) |
A simple model defined by Eqs. 1 and 3 is usually sufficient to calculate a UV resonance line or to make a prediction about the emitted flux at radio wavelength. Of course, one additionally needs to specify the electron temperature in the wind and, for the UV diagnostics, the incident radiation field at the inner boundary. For the latter the photospheric flux is chosen (usually from a photospheric model) and for the former a value equal or somewhat smaller than the effective temperature of the star is adopted assuming that the wind is in radiative equilibrium.
While this simple approach is entirely adequate to analyze UV resonance lines with regard to the velocity field and opacity structure (Sect. 2.4.1) and radio fluxes with regard to mass-loss rates (Sect. 2.4.4), a more complex treatment is needed as soon as lines and continua in the optical and infrared are included in the analysis. In these cases the spectral information usually originates simultaneously from the quasi-hydrostatic photospheric layers below the sonic point and from the stellar wind layers above. As has been demonstrated by Gabler et al (1989), such a situation requires the use of ``Unified Model Atmospheres'', which has now become the standard treatment for model atmospheres of hot stars with winds. Unified Models are stationary, in non-LTE and in radiative equilibrium, they are spherically extended and yield the entire sub- and supersonic atmospheric structure either taking the density and velocity structure from the hydrodynamics of radiation driven winds or adopting a smooth transition between an outer wind structure as described by Eqs. 1, 3 and a hydrostatic stratification. They can be used to calculate energy distributions simultaneously with ``photospheric'' and ``wind'' lines and, most importantly, they can treat the multitude of ``mixed cases'', where a photospheric line is contaminated by wind contributions. This concept turned out to be extremely fruitful for the interpretation of hot star spectra and has led to the rapid development of significant refinements and improvements in parallel by several groups. Basic papers describing the status of the work in the different groups are Sellmaier et al (1993), Schaerer & Schmutz (1994), Schaerer & de Koter (1997), Hillier & Miller (1998), Santolaya-Rey et al (1997), Taresch et al (1997) and Pauldrach et al (1994, 1998). For the investigation of global stellar wind parameters from optical spectra or energy distributions model atmospheres of this type are preferred in our discussion below.
At this stage, a short comment on the reliability of these ``standard wind models'' is necessary. It is certainly true that there is significant evidence for non-stationarity, clumpiness, shocks and deviations from spherical symmetry and radiative equilibrium (see A.F.J. Moffat et al 1994, L. Kaper & A.W. Fullerton 1998 and IAU Coll. No. 169, eds. B. Wolf et al 1999). There are two reasons why these phenomena are ignored in the standard diagnostics. First, the amplitudes of deviations from the smooth stationary model used are normally not very large (even in the cases where spectral variability looks dramatic, see Kudritzki 1999a) so that the standard analysis is thought to yield reliable average models of the stellar winds. Second, for very obvious reasons, the appropriate inclusion of deviations from the standard model requires a significant additional effort in the diagnostics and a development of new radiative transfer methods, a task which is not yet completed at this stage. A discussion of the possible effects will, however, be given in Sects. 4 and 5.
To discuss the physical connection of global stellar wind parameters with the stellar properties one needs an estimate of the stellar parameters such as effective temperature Teff, luminosity L, photospheric radius R*, gravity log g, chemical composition etc. There are two ways to proceed. The first one is to adopt general calibrations of effective temperature and bolometric correction with spectral type and to determine L, R* and Teff from de-reddened photometry, distance and spectral type. The stellar mass follows then from a comparison with evolutionary tracks in the HRD.
The second and more accurate way relies on model atmospheres to determine Teff and log g as the most fundamental atmospheric parameters by fitting simultaneously two sets of spectral lines, one depending mostly on Teff and the other on log g. For the former, one uses line profiles of different ionization stages (``ionization equilibrium'') and for the latter the higher (less wind-contaminated) Balmer lines. Fit curves in the (log g, log Teff)-plane along which the calculated line profiles of the two different sets agree with the observations then yield effective temperature and gravity together with an estimate of the uncertainties. For O-stars the He I/II ionization equilibrium is normally used ( Kudritzki 1980, Simon et al 1983, Bohannan et al 1986, Voels et al 1989, Kudritzki et al 1983 and 1992, Herrero et al 1992 and 1999a), which is also applied in the case of very early B-supergiants (Lennon et al 1991, McErlean et al 1998). For B-supergiants of later spectral type Teff is obtained from the Si II/III/IV ionization equilibrium (McErlean et al 1999) and for A-supergiants the Mg I/II equilibrium has proven to be very reliable (Venn 1995 and 1999, McCarthy et al 1995 and 1997). The model atmosphere approach will also yield the chemical composition of the stars from a fit of the complete line spectrum (see references above, but also Taresch et al 1997 and Haser et al 1998). Using the distance modulus the stellar radius is then obtained from the model atmosphere flux and de-reddened photometry which then yields the luminosity. The stellar mass follows from radius and gravity.
A few problems with this approach need to be discussed. Herrero et al (1992) in their quantitative spectroscopic study of a large sample of galactic O-stars detected a systematic ``mass discrepancy''. They found that for evolved O-stars approaching the Eddington-limit the stellar masses derived from evolutionary tracks and stellar luminosities are significantly larger than the masses obtained from spectroscopic gravities. Which masses are correct is still a completely open question. The most recent calculations by Langer and Heger (1998), Maeder (1998), Meynet (1998) indicate that stellar evolution including rotation and rotationally induced interior mixing would enhance the luminosity significantly for given mass. In addition, enhanced mass-loss along the evolutionary track would further reduce the mass and bring the evolutionary masses into agreement with the spectroscopic and wind masses (Langer et al 1994). On the other hand, since Herrero et al used hydrostatic NLTE models in their study and neglected wind contamination of the hydrogen and helium lines (Gabler et al 1989, Sellmaier et al 1993, Puls et al 1996) their spectroscopic masses may have been systematically underestimated. In addition, the neglect of metal line blanketing in their analysis could have caused a small effect (see Lanz et al 1996 versus Hubeny et al 1998).
It is important to note here that this uncertainty of stellar mass depending systematically on the approach used for the mass determination will introduce a systematic effect in the relationship between terminal stellar wind velocity and escape velocity from the stellar photosphere discussed in Sect. 3.
Another systematic uncertainty affects the effective temperature of O-stars at the earliest spectral types (O3 and O4), which in the classical work (see references above) relies on the strength of one single very weak He I line (l4471). Blanketing (Hubeny et al 1998) but also exotic effects as non-coherent electron scattering of He II resonance lines in the EUV (see Santolaya-Rey et al 1997) may have significant influence on this line. The introduction of new effective temperature indicators for these objects such as metal lines in the optical and UV leads to results which are contradictory at the moment (see de Koter et al 1998 versus Taresch et al 1997 and Pauldrach et al 1994). For a determination of the luminosity of these objects a careful investigation of this aspect is urgently needed.
A third very important uncertainty concerns the helium abundance of late O- and B-supergiants. The work by Lennon et al (1991) and Herrero et al (1992) led to the conclusion that the helium abundance in the atmospheres of such stars is significantly enhanced indicating the presence of CNO-processed material mixed from the stellar interior. While evolutionary tracks with rotational mixing support this result (see references above), most recent analyses by Smith and Howarth (1998) and McErlean et al (1998) indicate that the helium enhancement is probably much smaller if the non-LTE radiative transfer calculations include the effect of photospheric microturbulence of the order of 10 km/s in the rate equations. The problem is not completely solved at the moment and needs further investigation. For the determination of effective temperatures and mass-loss rates this uncertainty my turn out to be important (see Sect. 3).
A very interesting new route to determine stellar parameters is IR spectroscopy. Pioneering IR spectral classification work by Hanson et al (1994, 1996 and 1997) has demonstrated that K-band spectroscopy allows the determination of spectral type and luminosity class and, therefore, the determination of effective temperature and gravity in completely analogous way as optical spectroscopy. This new technique proves to be extremely valuable for massive hot stars embedded in highly dust-obscured regions of star formation such as ultra-compact or normal H II regions (Hanson 1998, Conti and Blum 1998, Drew 1998) or in the Galactic Centre (Najarro et al. 1994 and 1997, Figer et al 1998). Its impact on the determination of global stellar wind parameters will be discussed in Sect. 2.4.3.
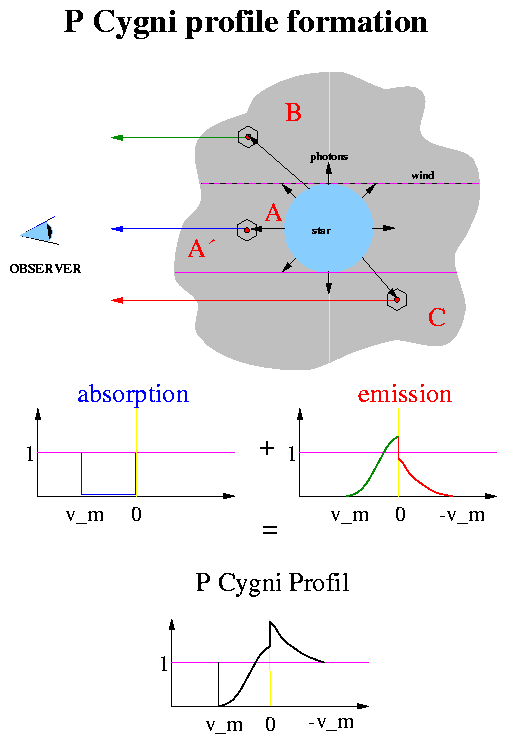
In principle, two types of lines are formed in a stellar wind, P Cygni profiles with a blue absorption trough and a red emission peak and pure emission profiles or absorption lines refilled by wind-emission. The difference is caused by the re-emission process after the photon has been absorbed within the line transition.
If the photon is immediately reemitted by spontaneous emission, then we have the case of line scattering with a source function proportional to the geometrical dilution of the radiation field (optically thin case) or an even steeper decline (roughly µ r-3, optically thick case), and a P-Cygni profile will result.
If the reemission occurs as a result of a different atomic process, for instance after a recombination of an electron into the upper level, after a spontaneous decay of a higher level into the upper level or after a collision, then the line source function will possibly not dilute and may roughly stay constant as a function of radius so that an emission line (or an absorption line weaker than formed by purely photospheric processes) results.
Typical examples for P-Cygni profiles are UV resonance transitions connected to the ground level, whereas excited lines of an ionization stage into which frequent recombination from higher ionization stages occurs will produce emission lines, as is the case, e.g., for Ha in O-supergiants.
Both types of lines can be used in principle to determine Mdot, v¥ and the shape of the velocity law b, where the advantages and constraints of the different methods will be discussed in the following, as well as the diagnostic possibilities related to continuous wind-emission in the IR and radio domain.
The specific shape of typical UV P-Cygni profiles in hot stars (e.g., from the resonance lines of C iv, N v, Si iv, O vi etc., see Walborn et al 1985) can be explained as follows. The profile consists of two components: Due to its interaction with wind material in front of the stellar disk, photospheric radiation is scattered out of the observer's line of sight, and an absorption trough is formed. Since the material is moving towards the observer, the absorption is blue-shifted (from zero to a frequency corresponding to some maximum velocity, see below). Superimposed onto the absorption trough is the second component, an emission profile which is formed in the wind lobes and again in front of the disk. This wind emission consists of photons which have been absorbed previously and are scattered into the observer's line of sight. Since the reemission occurs in both hemispheres of the wind (positive and negative projected velocities!), the corresponding profile is almost symmetrical with respect to line-center. Note, however, that the wind emission from material behind the photospheric disk is not visible (``occulted region''). Consequently, the symmetry is slightly distorted, and the emission profile on the red side is weaker than on the blue one. By adding the blue absorption trough and the emission profile, the typical shape of a P-Cygni line is readily understood.

P-Cygni lines are usually analyzed by means of the so-called ``SEI'' method (Sobolev plus exact integration, cf. Lamers et al 1987), which bases on the notion (Hamann 1981a) that the profile of such a line can be simulated with high precision if the source-functions of the components (usually two due to fine-structure splitting of the lower or upper level) are calculated in the Sobolev-approximation (for details, see Sobolev 1957 and Castor 1970) and only the ``Formal Integral'' is done exactly, i.e., accounting for the finite profile width. For purely scattering singlets then, the source function is given by the ratio of ``core penetration'' to total ``escape probability'' (Castor 1970), with straightforward generalizations in the case of doublet formation (Hamann 1981a; Olson 1982; Puls 1987; Lamers et al 1987).
The crucial quantity which controls the line formation process (both with respect to absorption as well as for defining the escape probabilities) is the Sobolev optical depth of the specified line,
|
(4) |
It is important to understand that the line optical depth in expanding atmospheres or winds has an entirely different character than in hydrostatic photospheres. In winds, the interaction photon/absorbing atom is restricted to a geometrically very narrow region of thickness Dr = vth/(v¥dv / dr) (the Sobolev length). Thus, optical depth is a local quantity in stellar winds described to a good approximation by Eq. 4. By expressing the occupation number in terms of local density r = Mdot/(4 pR*2 r2 v¥v), this quantity is given by
|
(5) |
Since we have assumed a velocity law of the form V(r) = v¥(1 -b/r)b (cf. Sect. 2.2), the quantities which can be derived at maximum by a fit to observed P-Cygni lines are v¥, b and k(r), so that, for known helium abundance, the information with respect to mass-loss shows up only in the product E(r) X(r) AkMdot/ R*. In consequence, mass-loss rates can be determined from P-Cygni lines only if the ionization/excitation fraction (as function of radius or a mean value, see below) of the specified ion/level is known as well as the abundance!
Saturated profiles are often found for C iv, N v in early O-stars and Si iv in late O-supergiants
and related to a large optical depth tS ³
3 everywhere in the wind. In contrast to photospheric profiles, this condition can be more easily achieved
for wind-lines due to their additional dependence on the velocity gradient dv / dr (Eq. 4).
For lines with a rather constant ionization/excitation fraction throughout the wind, the variation of line optical
depth depends only on the steepness of the velocity law,
|
(6) |
The absorption trough of such a saturated profile shows nearly zero intensity for all frequencies corresponding to velocities v = 0 ¼v¥, and the profile shape depends exclusively on the emission profile, i.e., on the source function in the optically thick case. As can be easily shown, however, for large optical depths this quantity depends only on the velocity field (with an asymptotic behaviour µ r-3), since the aforementioned ratio of escape probabilities becomes independent of line opacity, i.e., independent of any information concerning occupation numbers. Consequently, saturated profiles allow in principle an easy measurement of terminal velocities from the frequency position of the blue absorption edge as well as a determination of b from the shape of the emission peak, however only upper limits for the product of (E X AkMdot/R*) are possible.
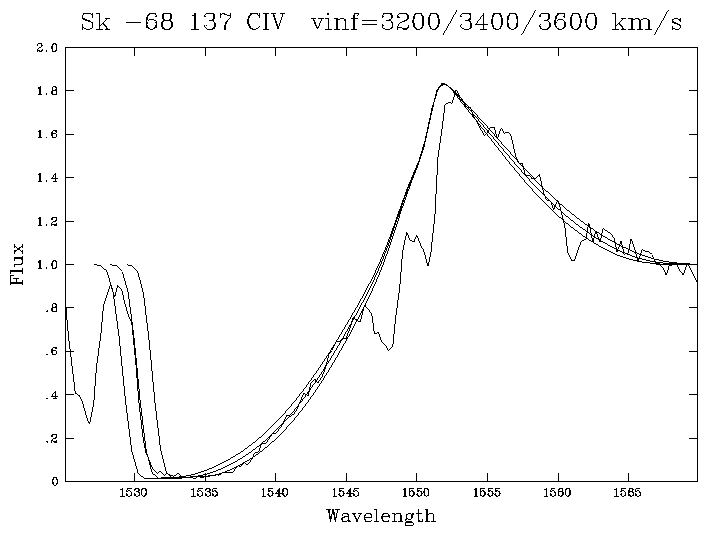
Figure 1 Radiative transfer calculations for the saturated UV C iv resonance doublet in the HST FOS spectrum of the LMC O3-star Sk - 67o137 for three different values (3200, 3400, 3600 km/s) of v¥. From Kudritzki (1998).
Figure 1 gives an example for the determination of v¥
by this method. High precision measurements with an accuracy of 5 percent can be obtained in this way (for details
and related methods, see Hamann 1981a/b, Lamers et al 1987, Groenewegen & Lamers 1989, Howarth & Prinja
1989, Groenewegen et al 1989, Haser et al 1995 and Haser 1995), and typical values b
= 0.7¼1.5 are found for OB-stars with supergiants having a clear tendency towards
higher b. For A-supergiants values as high as b = 3¼4 can be found (Stahl et al 1991 and Sect. 2.4.2).
Unsaturated profiles arise when tS becomes of order unity
or smaller somewhere in the wind, and decent diagnostics concerning k(r) or k(v) (Eq. 5), respectively, are possible in the corresponding region: Both the depth and shape of the absorption
trough as well as of the emission component (with source function(s) µ r-2)
become dependent on line opacity. Note, however, that in this case the terminal velocity can no longer be determined
since the absorption extends only to a certain maximum velocity < v¥. Additionally, the deduction of b becomes impossible
due to the intrinsic coupling of ionization fraction and velocity law in the definition of tS.
In order to derive a unique solution for k(v), the parameters v¥
and b have to be derived independently, e.g., from saturated profiles.
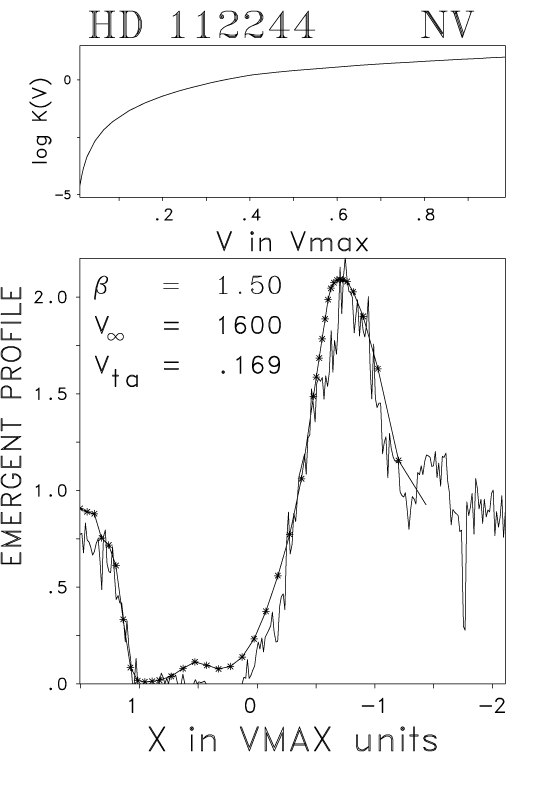
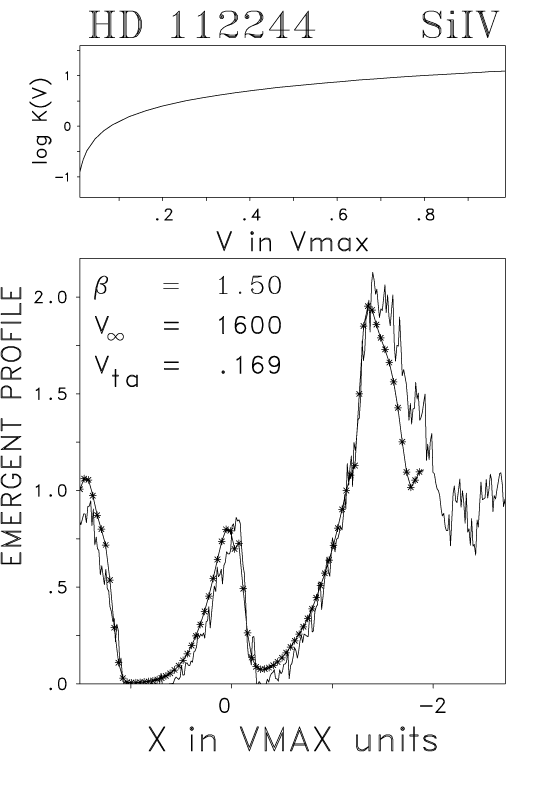
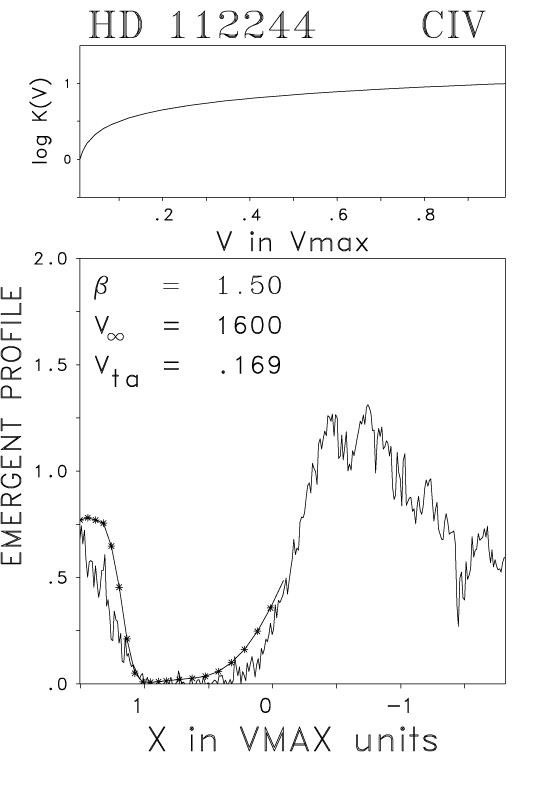
Line fits to unsaturated profiles can be obtained by either parameterizing the optical depth as function of velocity (Lamers et al 1987, Groenewegen & Lamers 1989), by parameterizing the run of k(v) (Hamann 1981a) or by a parameter-free analysis based on a Newton-Raphson method (Haser et al 1994; Haser 1995). In this way beautiful fits of the observed spectra can be obtained (see Figure below )
Radiative transfer fits of the IUE (high resolution) UV resonance lines of N V, Si IV and C IV of the galactic O-supergiant HD 112244 (O 8.5 Iab (f)). The abscissa is the wavelength displacement from the line centre measured in units of maximum displacement l0v¥/c. Each figure contains the values of b, v¥ and vta = vturb/v¥ in the outer wind obtained as the best fits. Above each profile the corresponding fit of k(v) (Eq. 5) is given as a function of v(r). From Haser (1995).
 |
 |
 |
Despite the impressive quality of those fits, their diagnostical value with respect to Mdot is marginal, since the ionization fractions have to be predescribed and depend on complicated details of theoretical model computations (cf. Sect. 2.2). In addition, a rather precise determination of the element abundances is needed.
Recently, however, Lamers et al (1999a) have suggested a significant improvement with respect to this dilemma: For unsaturated lines, it is easy to derive the column density of absorbers between velocities v1 and v2 from the actual fit quantity tS(v) itself, as well as the product of a mean ionization/excitation factor < qk > with MdotAk/R* in dependence of this column density (cf. Howarth & Prinja 1989). Extensive tables of column densities and products of (Mdot < qk > ) for large samples of O-stars have been determined by Howarth & Prinja (1989, pure Sobolev analysis) and Haser (1995).
If these data are now combined with independent determinations of mass-loss rates (and abundances and stellar radii are known with reasonable accuracy), empirical mean ionization factors < qk > can be determined. Lamers et al (1999) used the results from the UV diagnostic studies by Groenewegen & Lamers (1989) and Haser (1995) in conjunction with the latest results for mass-loss rates from Ha (Sect. 2.4.2) and thermal radio emission (Sect. 2.4.4) and derived empirical ionization/excitation fractions for all relevant UV transitions for selected O-stars covering the complete domain of spectral types and luminosity classes. Introducing calibrations of < qk > with effective temperature, it should then be possible to derive mass-loss rates from UV-profiles alone in future investigations (e.g., from FUSE-spectra), provided the abundances are known. In agreement with earlier results by Haser (1995), Lamers et al (1999a) showed that Si IV is best suited for this kind of approach.
Even earlier, it was pointed out by Walborn & Panek (1984) that this line can be used as an indicator for the stellar luminosity, an effect which has been theoretically explained by Pauldrach et al (1990) and relates to the fact that Si IV is always a trace ion in the O-star domain, with Si V (inert gas configuration) being the dominant ion. Thus, by means of a simplified NLTE argumentation (e.g., Abbott 1982) it is easy to show that X(r) has an explicit dependence proportional to density, namely X µ ne/W with electron-density ne and dilution factor W. For smooth winds then, X(v) µ r-bar/v and k(v) scales with Q2 instead of Qres. This increases the sensitivity of Si IV both with respect to Mdot (see above) as well as with luminosity, anticipating the tight coupling of mass-loss with luminosity in radiatively driven winds (Sect. 3 and 4). Note finally, that the scaling of Si iv resembles that of Ha discussed in the next subsection.
Problems. By means of the discussed line fits, precise ``measurements'' of v¥, b, vturb and column densities are possible, at least as long as one of the strategic lines is saturated and the contamination of unsaturated profiles with lines formed already in the photosphere is accounted for correctly (see Haser 1995).
The most severe problem of the above procedure is related to the presence of so-called black troughs in saturated profiles, which are extended regions (corresponding to several hundreds of km/s) in the the blue part of the profiles with almost zero residual intensity, cf. Figure 1. Without further assumptions, these troughs cannot be fitted, since in the usual line formation process only a very small frequency range (of order vth) with zero intensity is created. Furthermore, the observed blue absorption edges are much shallower than resulting from such simple simulations. To overcome both problems, Hamann (1981a, b) introduced a highly supersonic ``microturbulence'' of order Mach 10 present in the entire wind. Since in this case the intrinsic absorption profile becomes much broader, the observed troughs as well as the blue edges can be simulated (for a comprehensive discussion, see Puls 1993). Additionally, the position of the emission peak is red-shifted, in agreement with most observations (see also Sect. 2.4.2). Meanwhile, the assumption of a constant turbulence (used also by Groenewegen & Lamers 1989) has been relaxed (cf. Haser 1995), since the justification of a highly supersonic velocity dispersion close to the photosphere is physically problematic as well as excluded from the NLTE analysis of photospheric lines in hot stars, resulting in values of vturb below the speed of sound (e.g., Becker & Butler 1992). Thus, in order to fit the profiles, a linear increase of vturb as function of the underlying velocity law is assumed, starting at roughly sonic velocities up to a maximum value vta. The actual values are found in parallel with the determination of v¥ and b from line fits to saturated profile, and typical values for vta are of order 0.1 v¥.
In parallel to the introduction of a velocity dispersion as described above, Lucy (1982a, 1983) suggested an alternative explanation for the black trough generation by means of enhanced back-scattering in multiply non-monotonic velocity fields. Hydrodynamical simulations of time-dependent radiatively driven winds (Owocki et al 1988, Feldmeier 1995) indicate the possibility of such non-monotonic flows (cf. Sect. 5), and detailed UV line formation calculations on the basis of such models have shown that black troughs are actually created in the profiles of such models (Puls et al 1993a, 1994, Owocki 1994). Footnote: The determinations of v¥ by Howarth & Prinja (1989) rely in part on the presence of black troughs in saturated C IV lines.
Despite the continuous effort to derive mass-loss rates from UV P-Cygni lines, the basic problem remains that one has to know the mean ionization/excitation fractions as well as the element abundances rather accurately in order to derive reliable numbers. Fortunately, there is an alternative way to determine Mdot using the strength of the stellar wind emission in Ha as an indicator of mass-loss rates, where the ionization correction for Ha is much simpler and the hydrogen abundance is usually much less uncertain.
First quantitative NLTE calculations dealing with the wind emission of hydrogen (and helium lines) go back to Klein & Castor (1978). Then, Leitherer (1988), Drew (1990), Gabler et al (1990), Scuderi et al (1992), and Lamers & Leitherer (1993) realized the potential of Ha for the determination of mass-loss rates and derived first results for a variety of hot stars. Puls et al (1996) developed a fast method to obtain mass-loss rates from Ha profiles of O-type stars avoiding some systematic errors inherent in the approach of Leitherer (1988) and Lamers & Leitherer (1993). In the following, we want to consider some basic issues including the analysis of Ha from A and late B supergiants. For a comprehensive discussion with a number of detailed profile fits we refer to Puls et al (1996), McCarthy et al (1997, 1998), Puls et al (1998) and Kudritzki et al (1999).
As pointed out in the introduction to this section, the basic difference of Ha and related lines (including the IR emission lines discussed in the next section) relative to P-Cygni lines concerns the run of the source function, which is rather constant throughout the wind. The latter fact is true as long as those lines are fed predominantly from the spontaneous decay of the upper level or recombinations into both levels, so that the involved occupation numbers are almost in LTE with respect to each other, i.e., the source function is almost Planckian. This condition is met for O-stars and early B-stars. For cooler temperatures, however, the feeding of the involved levels from lines of the Lyman series becomes relevant, until, in the A-supergiant domain, these lines and the Lyman continuum become optically thick and the corresponding transitions are in detailed balance. Then, the second level of hydrogen (which is the lower one of Ha ) becomes the effective ground state of H I and the line behaves as a scattering line, thus displaying a typical P-Cygni signature.
Diagnostic potential. Since neutral hydrogen is almost always a trace ion in the winds of OBA stars (excluding the outermost wind and some narrow photospheric recombination region in the A-star domain), the same argumentation as made above for Si iv applies: The opacity of Ha depends on r2 (OB-stars) respectively r2/W (A-Supergiants), so that the actual quantity which can be derived by line fits is Q2, which manifests its sensitivity on and its diagnostic value for the determination of Mdot. Two instructive examples are given in Figures 2 and 3.
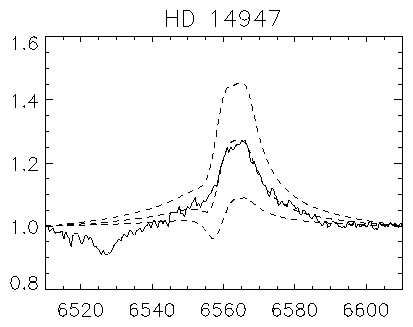
Figure 2 Ha line profile of the O 5 Iaf+ - supergiant HD 14947 compared with line fits as outlined by Puls et al (1996) adopting 10, 7.5 and 5.0 ×10⁻⁶ Msun/yr, respectively, for the mass-loss rate. From Kudritzki (1998).
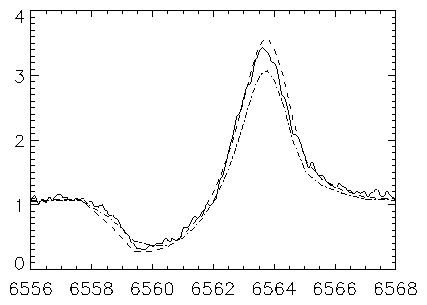
Figure 3 Ha line profile of the extreme A-supergiant 41-3654 (A3 Ia-O) in the Andromeda Galaxy M31 taken with the Keck HIRES spectrograph compared with two unified model calculations adopting b = 3, v¥ = 200 km/s and Mdot = 1.7 and 2.1 ×10⁻⁶ Msun/yr. Note the P-Cygni profile shape of Ha . From McCarthy et al (1997).
Ha emission in O/early B stars. Due to the thermal character of the wind emission and the large emitting volume of the wind, Ha profiles can exhibit enormous equivalent widths and emission peaks, provided the mass-loss rate is large enough. As shown by Puls et al (1996), the equivalent width (absolute value) of the wind emission scales with Q3/2 v¥ for (predominantly) optically thin and with Q4/3 v¥ for optically thick emission. Due to this overlinear dependence on mass-loss, the achieved accuracies for Mdot (or, more correctly, for Q) from lines with large wind emission are enormous and can reach values below 10 percent. Additionally, the shape of the velocity field (i.e., b) can be determined from the shape of the emission peak, due to the strong dependence of opacity with r2 µ (r4 v2)-1. By this method, Puls et al. (1996) where able to derive typical values b » 1 for O-type Supergiants, and the results for Q in this domain are in fair agreement with those from the simplified approach used by Leitherer (1988) and Lamers & Leitherer (1993).
From the above scaling relations, however, it is also obvious that the emission from thin winds is small, and moreover, almost ``hidden'' in the normal photospheric profile with a shape dominated by rotational broadening. In these cases then, detailed calculations on the basis of unified model atmospheres accounting for the transition to photospheric layers (cf. Sect. 2.2) as well as an exact line formation accounting for the finite profile width are required to derive reliable numbers. Without doing this, Q2 is easily overestimated by more than one dex.
In addition to these more theoretical considerations, even with the most elaborate methods uncertainties up to a factor of two in Mdot can arise if the absorption profile is only marginally filled and the shape of the velocity field in the lower wind part is NOT known (e.g., from UV resonance lines): Contrary to the case of strong emission lines, b cannot be derived in these cases, since the rotationally broadened absorption simply corrupts all diagnostic clues concerning the wind emission. (The rather strong dependence of the derived values of Mdot on b for marginal wind-emission can be easily seen from the run of the radial optical depth in the line, tS µ Q2 v(r)[1/( b)] - 3/r2.)
Ha emission in A/late B supergiants.
Since the Ha opacity in the winds of these stars scales with r2/W and the source function is dominated by line-scattering, the corresponding profiles are of P-Cygni type and usually visible until up to a frequency corresponding to v¥, contrasted to the O/B star case where this is true only for the most luminous objects. The latter fact allows to derive also v¥ in parallel with the other quantities and thus enables a complete wind analysis in the optical alone: Due to the additional factor 1/W » r2, compared to the O-star case from above, and the lower temperature, which increases the ionization fraction of H i significantly, the optical depth in Ha remains large up to v¥ in most cases, similar to the behaviour of strong UV resonance lines. Analogously, b can be derived with significant precision from the profile shape.
A detailed parameter study (based on the unified models by Santolaya-Rey et al 1997) as well as the required fit-procedure is given by McCarthy et al (1997, 1998). Kudritzki et al (1999) have used this method to obtain the wind parameters for a large sample of Galactic BA-supergiants. In accordance with earlier work by Stahl et al (1991), the derived velocity fields are significantly flatter than for O-stars, with typical values b = 3¼4. Interestingly, the observed slope of the blue absorption edges as well as the position of the emission peaks required also here to assume the presence of a velocity dispersion, of order 10... 20 km/s. Note, that the terminal velocities of A-type supergiants are a factor of 10 smaller than for O-type stars (cf. Sect. 3).
Of course, the derived values have to be consistent with the observations/simulations of other lines, most important the Hydrogen Balmer lines. Also these lines (especially Hb ) are contaminated by wind emission, and only a simultaneous fit of all lines with identical parameters (where Hg provides the required information concerning log g, cf. Sect. 2.3) allows to trust the results.
Problems. Globally, the errors in Q are of the order of 30 percent, with smaller values for dense and larger ones (the b problem) for thin winds. The agreement with mass-loss rates from thermal radio emission (Sect. 2.4.4) is satisfying (cf. Lamers & Leitherer 1993; Puls et al 1996). However, there are also a number of problems which shall be illustrated in the following.
In O/early B-stars, the Ha line is contaminated by a blueward blend of He ii (separated from the line center of hydrogen by roughly 2 Å corresponding to 100 km/s), which in a number of lines mimics the presence of a P Cygni type profile since it is mostly in absorption. In those cases where this blend is strong, present day simulations are partly unable to fit this component (see Herrero et al 1999b). The recipe here is to concentrate on the red wing of the H/He complex, which should give more reliable results due to its weaker contamination by the Helium blend, compared to the blue side.
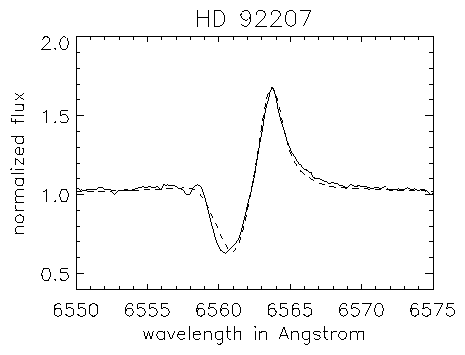
Additionally, a certain variability which can be severe in the blue absorption troughs of A-star profiles (cf. Kaufer et al 1996 and the discussion in Sect. 5) influences the derived results. Test calculations (see Kudritzki 1999a) have shown that these variations indicate a significant variation for the obtained values of v¥ and Mdot as function of time. The product of both, i.e., the momentum rate, remains however much more constant, with a maximum variation of order 0.2 dex for the extremely variable wind of HD 92207 (A0Ia).
Another problem results from stellar rotation. The thermal Doppler-width of Ha is much smaller than typical rotational velocities of early type stars (of order 100 km/s for OB-stars and 30... 40 km/s for A-supergiants). Thus, the central emission caused by the wind will certainly be broadened by rotation. Because of conservation of specific angular momentum, the azimuthal velocity in the wind varies according to vrot(R*, q)/r, where vrot(R*, q) is the photospheric rotation velocity at co-latitude q. Thus, for the most important regime of Ha formation ( r = 1¼1.5), both the value of vrot itself as well as its variation (i.e., , the differential rotation) should have important consequences for the line shape.
Before we further comment on this problem, note that the diagnostics of UV resonance lines in OB-stars are barely affected by this effect, simply because at least the stronger lines do only mildly (if at all) react to any reasonable value of vrot sini. In contrast to usual Ha profiles, these resonance lines are formed throughout the wind, which decreases the ratio of vrot sini to total line width (v¥). Moreover, the average rotational velocities are smaller since vrot®0 in the outer wind, and the intrinsic Doppler width is larger due to the velocity dispersion derived. Note however also, that rotation might influence the global hydrodynamical structure, a problem which we will consider in Sect. 4.2.
With respect to the formation of Ha (and the other Balmer lines, of course), it turns out that the presence of rotation has to be accounted for in order to obtain good fits (except for very strong and very broad emission lines which, in analogy to strong UV resonance lines, are barely influenced). The usual strategy (cf. Puls et al 1996, Herrero et al 1999b) is to fold the final profile with a rotational curve of width vrot sini, where this value can be derived from photospheric metal lines. For a number of (fast rotating) objects, it turned out that the value of vrot sini indicated by Ha is smaller than for lines less contaminated by the wind, e.g., Hg . This shows very clearly the presence of differential rotation in some average sense, in accordance with test calculations by Petrenz & Puls (1996) based on a rigorous treatment of the problem. In conclusion, some average value < vrot sini > to be determined in parallel with the other parameters becomes an additional part of the Ha fitting procedure, at least for lines which are neither weak ( < vrot sini > ®vrot sini(R*)) nor strong.
Of course, the problems discussed here would be of only minor importance if our general assumption of smooth winds (at least in the lower, line forming region) were severely violated. Due to the intrinsic dependence of the Ha line opacity on r2, any significant degree of clumpiness would lead our approach to overestimate the mass loss rates. We will come back to this problem in Sect. 5.
The dramatic progress of IR astronomy in the last decade has opened a completely new window for the systematic investigation of winds around hot stars. Gabler et al (1989) in their first paper on unified model atmospheres realized the importance of IR emission and absorption lines for a quantitative understanding of the physics of hot stars atmospheres and winds and pointed out the potential of this new spectral range. A wealth of observational material is now available (see for instance Hanson et al 1996 or Figer et al 1997) for quantitative work.
The theoretical framework for the analysis of IR spectra is in principle identical to that of the optical and UV lines. As for those cases, also the IR spectra of hot stars show pure emission lines, P-Cygni profiles and wind-contaminated absorption lines. However, since the IR continuum of objects with strong winds (contrary to the optical continuum) is formed in the supersonic part of the wind, IR lines sample different depths of a stellar wind and give additional information about the shape of the velocity field. Najarro et al (1997a), Lamers et al (1996) and Hillier et al (1998) have investigated this important effect using high quality ground-based (optical and IR) and ISO IR spectra.
The winds of hot stars of extreme luminosity and with strong IR emission characteristics in the Galactic Centre have been investigated by Najarro et al (1994, 1997b) and Figer et al (1998). Crowther et al (1998) have provided beautiful diagnostics of late Of-supergiants and WNL stars in order to probe wind velocity fields, effective temperatures and blanketing effects in the photospheric EUV continua.
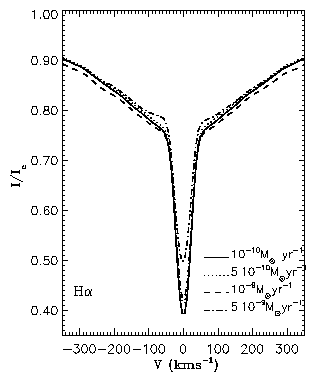
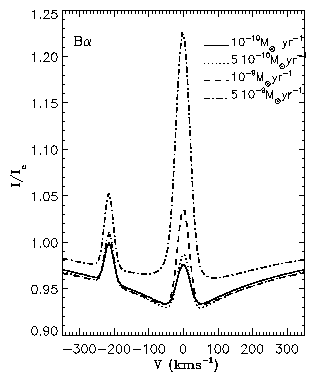
In the case of very thin winds with extremely low mass-loss rates IR line profiles turn out to be outstanding diagnostic tools for the determination of mass-loss rates clearly superior to optical lines such as Ha. Since hn/kT << 1 in the IR, stimulated emission becomes important, and non-LTE effects in the line (caused by the presence of the wind) are substantially amplified (Mihalas 1978, Kudritzki 1979), leading to strong emission even for very small mass-loss rates, as has been pointed out by Najarro et al (1998, see Figure below).
 |
 |
Not only the spectral lines, but also the IR, (sub)millimeter and radio continua can be used to analyze the properties of the wind plasma. Actually, they constitute one of the most reliable diagnostic tools for this purpose, since they are based on rather simple atomic/radiation transfer processes, while lines usually require to consider a number of nasty details such as NLTE, line broadening etc.
The basic idea is to investigate the excess relative to the flux predicted by photospheric model atmospheres, which is attributed to free-free (``Bremsstrahlung'') and bound-free emission in the winds and becomes significant at longer wavelengths, due to the l3 dependence of the corresponding opacities and the resulting geometrical increase of the effective photosphere. In most cases the emission arises from thermal electrons (deduced from the spectral index of the radiation, see below); however, there exists also a significant fraction (roughly 30%) of non-thermal emitters (Bieging et al. 1989 and references therein, see also Altenhoff et al. 1994). In the following, we will mainly discuss thermal emission and briefly consider non-thermal effects at the end of this subsection (see also Sect. 5).
The pioneering work on IR and radio free-free emission from hot star winds was presented independently by Wright & Barlow (1975) and Panagia & Felli (1975). Both publications showed that the continuum flux Sn at long wavelengths for an optically thick, spherically symmetric and isothermal envelope expanding at constant velocity scales with Sn µ n 0.6. Moreover, the observed radiation depends only weakly on the electron temperature in the wind, and is set essentially by the distance to the star d, the mass-loss rate and the terminal velocity via
|
(7) |
The exclusive use of radio observations, however, is rather problematic. Since the excess flux (= total flux in the radio domain) scales with n 0.6, OB-stars will be generally weak radio sources (which prohibits the use of this method for extragalactic work), and useful radio observations can be obtained only for nearby stars with rather dense winds. Moreover, since the spectral index of a non-thermal component is negative (e.g., = -0.7 for synchrotron emission), the radio domain can be more easily contaminated than shorter wavelengths, e.g., the (sub)millimeter regime (see Altenhoff et al 1994 and Contreras et al 1996).
By concentrating on lower frequencies, however, at least in the IR the presence of a velocity stratification has to be accounted for, as was pointed out already by Wright and Barlow (1975): In contrast to the radio/submm regime, the wind becomes optically thick at velocities well below v¥. By using a velocity law with a shape that fitted the IR-continuum of P-Cygni, Barlow & Cohen (1977) took these problems into account and performed an extensive IR analysis of some 40 OBA supergiants.
The effects of a more general velocity field, together with the inclusion of bound-free opacities and an estimate concerning the influence of electron scattering (important only at very high wind densities, e.g. in the winds of WRs) were discussed by Lamers & Waters (1984a). They expressed the non-dimensional excess in terms of a curve of growth, from which the velocity law and the mass-loss rate can be derived simultaneously. Extensive tables of curves of growth as well as the required gaunt-factors as functions of chemical composition were published by Waters & Lamers (1984).
(Mass-loss rates from) Radio/submm observations. Early radio measurements (mostly with the VLA at 2 and 6 cm) and subsequent determinations of mass-loss rates of O/early B-star winds have been published by Abbott et al (1980, 1981) and Bieging et al (1989). For a number of these stars, Howarth & Brown (1991) have added VLA fluxes at 3.6 cm. These measurements (see also the catalogue compiled by Wendker 1987) provide one of the most complete data sets and have been used, e.g., in the comparison with Ha mass-loss rates by Lamers & Leitherer (1993) and Puls et al (1996) as well as for the calibration of ``empirical ionization'' fractions (Lamers et al 1999a, see Sect. 2.4.1). Recently, Leitherer et al (1995) studied a number of (very) dense winds (including two Of-star winds) with the Australia Telescope Compact Area at 3.5 and 6.25 cm, and Scuderi et al (1998) have detected another 7 new OB radio sources with the VLA. Radio observations of later spectral types (supergiants between B2 and F8) have been performed by Drake & Linsky (1989) and were used by Kudritzki et al (1999) to compare with corresponding Ha data. Since most of these observations comprise at least two frequency points, and taking into account the 1.3 mm observations by Leitherer & Robert (1991) performed with the Swedish-ESO Submillimeter Telescope at La Silla, the presence of non-thermal components could be easily detected from the spectral index. Of course, only those objects with purely thermal emission have been used to derive mass-loss rates. In addition to the data by Leitherer & Robert, Altenhoff et al. (1994) have observed approx. 20 OB stars at 1.2mm with the IRAM 30m telescope at Pico Veleta.
Due to the enormous extension of the radio photosphere for objects with large Mdot, it is, in principle, also possible to resolve the radio emitting region. In this way, White & Becker (1982, see also Skinner et al 1998) resolved the wind of P-Cygni at 6cm and found an apparently spherically-symmetric wind, at an electron temperature of 18,000 ±2,000 K, i.e., of order Tef f » 18,500 K.
IR-excess.
Following the work by Barlow & Cohen (1977) who found significant excess for a number of objects at 10m (for some objects down to 2.2m), Tanzi et al (1981), Castor & Simon (1983), and Abbott et al (1984b) tried to derive Mdot (and partly the shape of the velocity fields) for a number of OB stars from the IR excess in various bands. Bertout et al (1985) analyzed a large sample of early-type stars in OB-associations and pointed out that reliable measurements of the excess are only possible for stars with significant wind density (Mdot ³ 10-6 Msun/a) and/or a rather flat velocity profile. IRAS observations between 10...100m were used to analyze one of the Rosetta-stones among stellar winds, the wind of z Pup (O4 If). From these observations, Lamers et al (1984) could exclude older models claiming a hot or warm base corona (thus again: wind temperature » Tef f), and derived a mass-loss rate and velocity profile with b = 1, in agreement with present findings from Ha . A recent re-analysis of most of the described data (IR-excess and radio-fluxes simultaneously) was performed by Runacres & Blomme (1996), who found that the majority of the observations is consistent with present theoretical work. For four of their program stars (incl. z Pup and a Cam), however, they claimed the presence of an additional emission mechanism. Footnote: Investigations by F Najarro (priv. comm.) have shown that consistent solutions can be obtained also in those cases, however with a b-value larger and a mass-loss rate smaller than derived from Ha .
Problems. Generally, the agreement between the radio and IR diagnostics on the one side and the Ha analysis on the other is satisfying (cf. Lamers & Leitherer 1993; Puls et al 1996; Kudritzki et al 1999). However, there are also problematic cases (see above) connected with too high an IR-excess compared to radio- and Ha measurements. An instructive example is discussed by Kudritzki et al (1999) for the case of HD 53138 (B3Ia), where the Ha measurement is consistent with the (upper limit) of the observed radio flux from Drake & Linsky (1989). In contrast, the 10m-excess derived by Barlow & Cohen (1977), which is also peculiarly high compared with other wavelengths, would result in Mdot a factor 20 higher. By investigating the CDS Catalog of Infrared Observations (Gezari et al 1999), it turns out that many stars show a significant scatter in the IR-photometry, which might be attributed to a photometric variability of B-supergiants. Thus, the ``measurement'' of an IR-excess (requiring the ``subtraction'' of combined wind+photospheric fluxes in the IR and purely photospheric fluxes in the optical/near IR) becomes difficult unless the complete energy distribution is observed simultaneously.
An alternative explanation might be given by the presence of clumping, which, in analogy to the case of Ha , would increase the IR excess due the r2-dependence of opacity. (The inconsistency of IR and Ha -fluxes would then point to depth-dependent clumping factors, cf. Sect 5). Simple methods to incorporate clumping in the IR-diagnostics have been proposed by Abbott et al (1981) and Lamers & Waters (1984b). A first comparison with time-dependent models has been given by Puls et al (1993b), and Blomme & Runacres (1997), on the basis of a simplified ``partial shell'' description, have pointed out that a small amount of clumping is sufficient to reconcile the discrepancies found in their previous work.
Non-thermal emission. As mentioned earlier, there is ample evidence of non-thermal emission in hot star winds. First observational findings were reported by White & Becker (1983) and Abbott et al (1984a), and latest measurements (for WRs) were presented by Chapman et al (1999). Although it seems to be clear that the non-thermal emission is due synchrotron radiation from relativistic electrons, different agents responsible for the acceleration are discussed in the literature: wind accretion onto compact objects (Abbott et al 1984a), wind-wind collisions in binary systems (Stevens 1995), magnetic reconnection in single or colliding winds (Pollock 1989) and first-order Fermi acceleration in the shocks (randomly) distributed in stellar winds (Chen & White 1994) which are thought to be responsible for the emission of X-rays as well, which we discuss in the following.
Among the first surprising discoveries of the Einstein observatory was the detection that all O stars are soft X-ray emitters (Harnden et al 1979, Seward et al 1979). It was soon found that the X-ray luminosity is roughly correlated with the stellar luminosity: logLx/Lbol » -7 ±1 (Seward et al 1979, Pallavicini et al 1981, Chlebowski et al 1989). The scatter in this relation is very large indicating a dependence on additional parameters.
The source of the O-star X-ray emission is widely believed to be shocks propagating through the stellar wind (Lucy & White 1980, Lucy 1982b, Cassinelli & Swank 1983, McFarlane & Cassinelli 1989) where the shocks may result from a strong hydrodynamic instability of radiation driven winds (see also Sect. 5). ROSAT and ASCA observations of O- and B-stars have confirmed this interpretation (Hillier et al 1993, Cassinelli et al 1994, Cohen et al 1996, 1997a and b, Berghöfer et al 1997). Assuming a simple model of randomly distributed shocks in a stellar wind, where the hot shocked gas is collisionally ionized and excited and emits spontaneously into and through an ambient ``cool'' stellar wind with a kinetic temperature of the order of the effective temperature, these authors were able to determine shock temperatures, filling factors and emission measures. The diagnostic situation differs between B-stars where the winds are usually optically thin at X-ray wavelengths and O-stars, where the winds can become optically thick and X-ray radiative transfer is needed. For the latter case, Feldmeier et al (1997a) have developed a refined diagnostic model including post-shock cooling zones for radiative and adiabatic shocks (see Figure below).
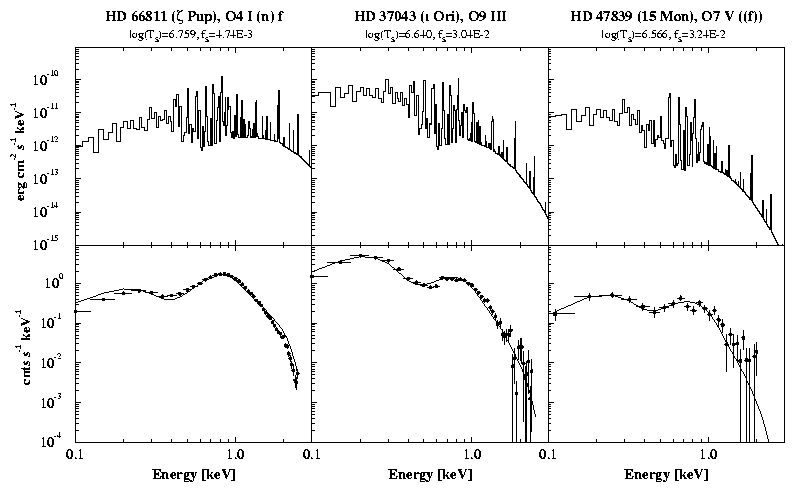
Calculated X-ray spectrum for three O-stars (upper panel) and compared with ROSAT PSPC observations (lower panel). For the latter the calculations have been convolved with the PSPC instrumental profile and response function. Note the potential gain of information as soon as instruments with higher spectral resolution such as XMM or Chandra become available. From Feldmeier et al (1997a).
Kudritzki et al (1996) applied these techniques on a larger sample of O-stars observed with ROSAT and found a dependence
of the filling factor of the X-ray emission on r-bar (which is proportional to the inverse
cooling length of the shocks) leading to a additional dependence of log Lx on the average
density in the stellar wind. By a simple scaling analysis of the involved X-ray emission and absorption processes,
Owocki & Cohen (1999) showed that the ``natural'' scaling for optical thin winds is given by
Lx µ (Mdot/v¥)2
and for optically thick winds by
Lx µ (Mdot/v¥)1+s,
if one assumes a radial dependence of the filling factor as f µ rs. The loose correlation Lx µ Lbol for thick winds can then be reproduced if one allows for a modest radial fall-off of this quantity (s » -0.25¼-0.4).
An alternative model has been suggested by Feldmeier et al (1997b) based on detailed time-dependent hydrodynamic models, where cloud collisions in an inhomogeneous wind lead to X-ray emission.
For the analysis of stellar winds the existence of X-ray emission is important for two reasons. First, their direct spectral diagnostics - in particular in view of X-ray telescope with spectrographs of sufficient resolving power as the Chandra satellite - will allow to investigate the limitations of the standard model of Sect. 2.1. Here a particularly promising approach is the simultaneous investigation of optical line and X-ray variability (Berghöfer et al 1996, Berghöfer & Schmitt 1994). Second, the X-rays and EUV photons emitted by the shocks severely affect the degree of ionization of highly ionized species such as C IV, N V and O VI and the diagnostics of their resonance lines observable in the far UV (see MacFarlane et al 1993, Pauldrach et al 1994, Taresch et al 1997, Haser et al 1998). In this sense, they introduce an additional uncertainty as long as the modeling of the shock emission is not constrained well enough.
The diagnostic methods of stellar winds described in the previous section have been applied to a large number of early type stars. In this section, we will discuss the results of these studies, in particular the empirical correlations of the global stellar wind parameters with stellar parameters. We will first discuss terminal velocities, mass-loss rates and wind momenta of galactic stars and then investigate the influence of stellar metallicity by a comparison with stars in the Magellanic Clouds.
In two pioneering papers compiling terminal velocities of winds from massive hot stars as function of stellar parameters Abbott (1978, 1982) demonstrated for the first time the existence of a correlation with effective temperature and photospheric escape velocity. These papers have induced a number of systematic and comprehensive studies using refined diagnostic methods and analyzing the full UV spectroscopic material available from IUE and HST high (and medium) resolution observations. We mention here the work by Groenewegen et al (1989), Groenewegen & Lamers (1989), Howarth & Prinja (1989), Prinja et al (1990), Lamers et al (1995), Haser (1995), Howarth et al (1997) on massive stars in the Galaxy. These papers have very convincingly confirmed the correlations proposed by Abbott and have provided quantitative coefficients to describe them on a solid statistical basis.
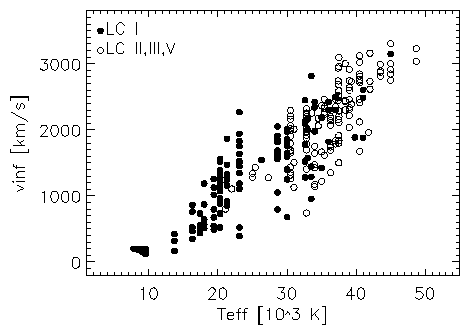
Figure 4 Terminal velocities as a function of effective temperature for massive hot stars of different luminosity classes. The data for B- and O-stars (Tef f ³ 10000 K) are taken from Prinja (1990), Prinja & Massa (1998) and Howarth et al (1997), who used the effective temperature scale of Humpreys & McElroy (1984) for the conversion of spectral type to Tef f. The data for A-supergiants (Tef f £ 10000 K) are from Lamers et al (1995).
|
|
|||||||
| sp. type | LC I |
LC II |
LC III |
LC V |
sp. type |
LC Ia |
LC Ib |
|
O3 |
3000 |
|
3200 |
B0 |
1450 |
1700 | |
|
O4 |
2400 |
|
3000 |
B0.5 |
1450 |
1400 | |
|
O5 |
2100 |
|
2800 |
2900 |
B1 |
1200 |
1000 |
|
O5.5 |
2000 |
|
|
B1.5 |
780 |
950 | |
|
O6 |
2300 |
|
2500 |
2600 |
B2 |
540 |
840 |
|
O6.5 |
2200 |
|
2600 |
2600 |
B3 |
490 |
|
|
O7 |
2100 |
2400 |
2600 |
2400 |
B5 |
270 |
470 |
|
O7.5 |
1900 |
2300 |
2300 |
2100 |
A0 |
160 |
180 |
|
O8 |
1500 |
2000 |
2200 |
1900 |
A1 |
160 |
|
|
O8.5 |
2000 |
|
2300 |
1900 |
A2 |
170 |
|
|
O9 |
1900 |
2100 |
2000 |
1500 |
A3 |
180 |
|
|
O9.5 |
1700 |
1720 |
1600 |
|
A5 |
180 |
180 |
|
O9.7 |
1700 |
2000 |
|
A8 |
|
200 | |
|
|
Figure 4 demonstrates that v¥ and
spectral type or Tef f, respectively, are correlated. Table 1 gives
average values as a function of spectral type. Since terminal velocities can be usually measured with an accuracy
of 10 % (see the previous section) and the determination of spectral type is usually accurate to one subclass,
the scatter must have an intrinsic physical reason. We attribute it to the fact that the dependence of v¥ on Tef f is indirect through the photospheric escape velocity
vesc which becomes smaller with smaller Tef f for main sequence stars and when
massive stars evolve towards lower temperatures to become supergiants. This means that, on the average, stars with
lower effective temperature are expected to have slower winds. However, at a given effective temperature even stars
of similar luminosity class will have different gravities and different photospheric escape velocities leading
to a significant spread of terminal velocities.
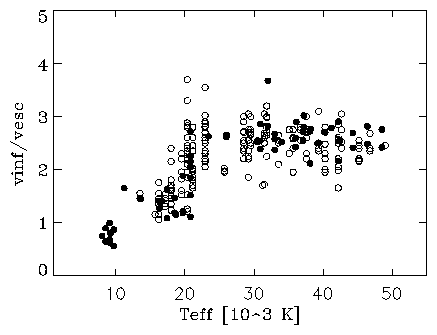
Figure 5 The ratio of terminal velocity to photospheric escape velocity as a function of effective temperature. Open symbols: Prinja & Massa (1998); solid symbols: Lamers et al (1995).
The direct dependence on the photospheric escape velocity is shown in Figure 5,
again as a function of Tef f. It is important to note that the photospheric escape velocity includes
the reducing effect of Thomson scattering on the gravitational potential
|
(8) |
From the definition of vesc it is clear that the determination of stellar escape velocities requires the knowledge of stellar masses and radii. For the construction of Figure 5 this has been done by adopting effective temperature, bolometric correction and absolute magnitude calibrations as function of spectral type and luminosity class to determine stellar luminosities, which are then used to estimate stellar masses from evolutionary tracks. In Sect. 2.3 we mentioned the ``mass discrepancy'' between masses determined in this way and masses determined from individual NLTE spectral analyses of objects with well known distances, which yield individual effective temperatures, gravities and radii with presumably higher precision.
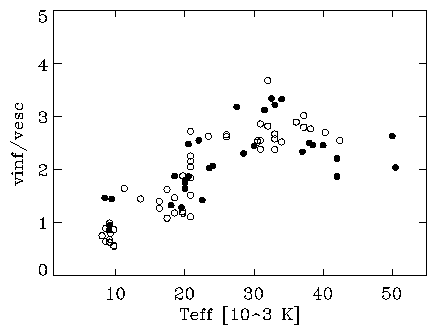
Figure 6 The ratio of terminal velocity to photospheric escape velocity as a function of effective temperature for supergiants of luminosity class I. Open symbols: Lamers et al (1995); solid symbols: Puls et al (1996), Kudritzki et al (1999). Note that for the solid symbols the escape velocities are obtained from detailed non-LTE analyses of individual objects.
Figure 6 compares results obtained by these two alternative methods in the case
of supergiants of luminosity class I, where the effects of the ``mass discrepancy'' is expected to be largest.
There are indications of small systematic effects but the general result is very similar. For effective temperatures
larger than 21000 K the ratio of v¥ to vesc
appears to be roughly constant. At 21000 K there is a sudden transition towards a significantly smaller but
also constant ratio (Lamers et al 1995), which is interpreted as the result of the fact that due to changes in
ionization different ionic species start to drive the wind (for further discussion and references see Sect. 4).
Another step in the v¥ to vesc ratio might be
present at 10000 K, although the few results from the individual spectroscopic analyses in this temperature
range obtained by Kudritzki et al (1999) do not fully confirm such a conclusion. Summarizing the results from Howarth
& Prinja (1989), Prinja et al (1990), Lamers et al (1995), Howarth et al (1997), Prinja & Massa (1998),
Puls et al (1996) and Kudritzki et al (1999), a reasonable scaling formula for the terminal velocity is given by
|
(9) |
A completely independent confirmation of the correlation of terminal with photospheric escape velocities comes from the investigation of Central Stars of Planetary Nebulae (CSPN). Although these objects have a completely different stellar interior and are in a completely different phase of stellar evolution as post-AGB objects of 0.5 to 0.7 Msun, they are certainly (very) hot stars. They evolve from the AGB towards very hot temperatures with roughly constant luminosity. Many of them have optical and UV spectra very similar to O-stars. Spectroscopic non-LTE studies carried out by Méndez et al (1988), Perinotto (1993) and Kudritzki et al (1997) and using the same diagnostic techniques as outlined in Sect. 2 have made it possible to constrain the evolution of these objects and to estimate stellar distances and masses. They have also allowed a discussion of stellar wind properties along the evolution with constant luminosity and constant mass from the right to the left in the HRD (see also Pauldrach et al 1989).
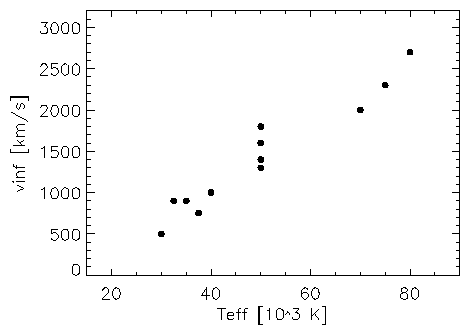
Figure 7 Terminal velocities of winds from Central Stars of Planetary Nebulae with O-type spectra as a function of effective temperature. Data are from Méndez et al (1988), Pauldrach et al (1989), Perinotto (1993), Haser (1995) and Kudritzki et al (1997).
Figure 7 shows the striking relationship of v¥
with Tef f for these objects. The interpretation of this diagram is straightforward. Since CSPN
shrink during their evolution towards higher temperatures, their photospheric escape velocity increases and the
terminal velocity which depends on vesc increases as well. Adopting an average mass of 0.58 Msun
for these post-AGB objects (comparable to the average mass of White Dwarfs, see Napiwotzki et al 1999) and a corresponding
luminosity according to the core mass - luminosity relationship (see Schönberner 1983, Wood & Faulkner
1986) one can calculate escape velocities for each object of Figure 7 and compare
the ratio of v¥ to vesc with the case of O-stars.
In this way, agreement with the O-stars at least for CSPN with Tef f £
50000 K is obtained. However, as stressed by Kudritzki et al (1997), much smaller escape velocities and ratios
v¥ to vesc of order 3 to 5 are found if gravities
and radii from their non-LTE spectroscopy are used directly. Kudritzki et al (1997) attribute this disagreement
to either some unknown defect of their spectral analysis procedure or a failure of the core mass-luminosity relationship
applied.
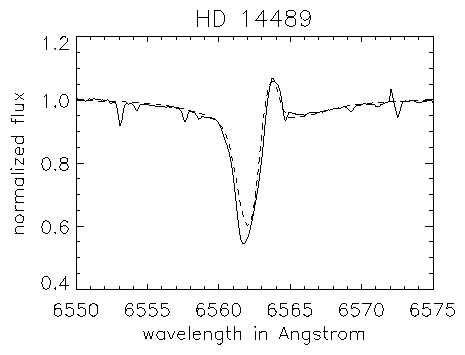
During the past three years there have been comprehensive studies to re-investigate the mass loss rates of galactic hot stars by analyzing Ha profiles based on unified non-LTE model atmospheres. Since the only requirement is that a good spectrum can be taken, mass loss rates for a much larger number of objects can be determined with this method than with the method analyzing radio emission.
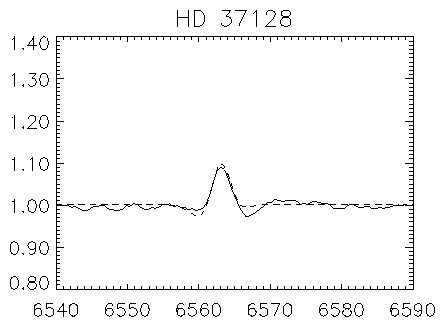
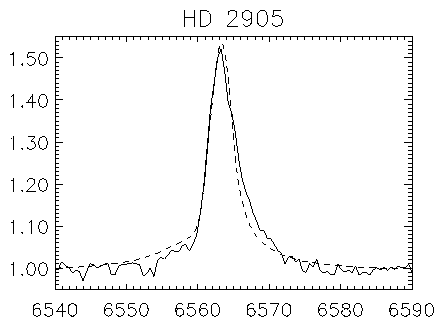
Puls et al (1996) and Herrero et al (1999b) have investigated the mass-loss rates of O-stars. Kudritzki et al (1997) studied CSPN and Kudritzki et al (1999) determined mass loss rates of galactic A- and B-supergiants. The figure below gives an impression of the Ha line profile fits achieved.
 |
 |
 |
 |
In the following, we summarize their results.
The best way to discuss the strengths of stellar winds is in terms of the wind momentum - luminosity relationship (WLR). Since the winds of hot stars are driven by radiation, it is intuitively clear that the mechanical momentum of the stellar wind flow should be mostly a function of photon momentum. Indeed, the theory of radiation driven winds predicts (see discussion in Sect. 4) that the ``modified stellar wind momentum'' depends directly on luminosity through the WLR
|
(10) |
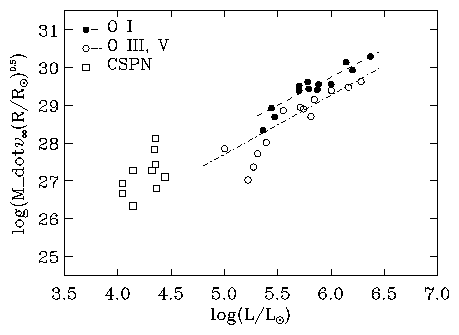
Figure 8 Modified wind momenta of galactic O-stars and Central Stars of Planetary Nebulae as a function of luminosity. The WLRs for O-supergiants and O-giants/dwarfs obtained by linear regression are also shown. Data from Puls et al (1996), Herrero et al (1999b) and Kudritzki et al (1997).
Figure 8 shows modified wind momenta of O-stars and CSPN as a function of luminosity.
It is obvious that the O-supergiants follow a tight WLR as described by Eq. 10 over at
least 1 dex in luminosity. The coefficients of the corresponding linear fit are given in Table 2.
|
|
|||
| sp. type | log D0 |
x |
a¢ |
|
A I |
14.22±2.41 |
2.64±0.47 |
0.38±0.07 |
|
mid B I |
17.07±1.05 |
1.95±0.20 |
0.51±0.05 |
|
early B I |
21.24±1.38 |
1.34±0.25 |
0.75±0.15 |
|
O I |
20.69±1.04 |
1.51±0.18 |
0.66±0.06 |
|
O III, V |
19.87±1.21 |
1.57±0.21 |
0.64±0.06 |
|
|
The situation for O-giants and -dwarfs is similar, however the WLR is shifted downwards to lower wind momenta and at the low luminosity end the situation is somewhat confusing. Two objects (z Oph and HD 13268) with logL/Lsun £ 5.3 fall clearly below the relationship. Both are rapid rotators with very thin winds. Several additional effects may become important in such a situation, as will be discussed in Sect. 4.
The fact that the CSPN as objects of significantly lower luminosity and of completely different evolutionary status have wind momenta corresponding to the extrapolation of the WLR of O-stars must be regarded as an encouraging success of the interpretation of winds in terms of radiative driving and of the concept of the WLR.
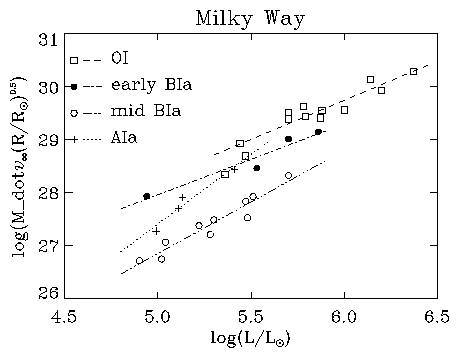
Figure 9 Wind momenta of galactic O-, early B-, mid B- and A-supergiants as a function of luminosity together with the corresponding WLRs obtained by linear regression. Data from Puls et al (1996), Herrero et al (1999b) and Kudritzki et al (1999).
Figure 9 compares wind momenta of O-, B-, and A-supergiants. For all these different
spectral types a tight relationship between wind momentum and luminosity is found. However, the WLR varies as function
of spectral type. Wind momenta are strongest for O-supergiants, then decrease from early B (B0 and B1) to mid B
(B1.5 to B3) spectral types and become stronger again for A-supergiants. The slope of the WLR appears to be steeper
for A- and mid B-supergiants than for O-supergiants. The interpertation of this result is given in Sect. 4.
It is very obvious that the global properties of winds must depend on metallicity. Since the winds of hot stars are driven by photon momentum transfer through metal line absorption, certainly the wind momentum rate and possibly the terminal velocities must be a function of stellar metallicity. The ideal laboratory to test the metallicity dependence are the Magellanic Clouds.
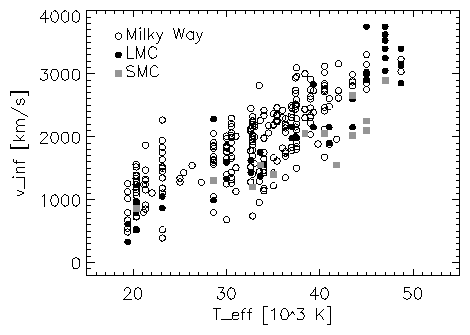
Figure 10 Terminal velocities of O-stars in the Galaxy, LMC and SMC as a function of effective temperature. For the conversion of spectral type into effective temperature, the scale by Humphreys & McElroy (1984) was used for simplicity. Data from Howarth et al (1997), Prinja & Crowther (1998), de Koter et al (1998), Puls et al (1996) and Haser (1995).
Figure 10 compares terminal velocities of O-stars in the Galaxy, the Large and
the Small Magellanic Cloud. Although there is a large scatter in this diagram, because stars of different luminosity
classes and photospheric escape velocities are not disentangled, there is a clear indication that on the average
wind velocities in the metal poor SMC are smaller. For the LMC, the situation is not so clear.
Wind momenta of O-stars show a definite trend with metallicity. This is demonstrated by Figure 11.
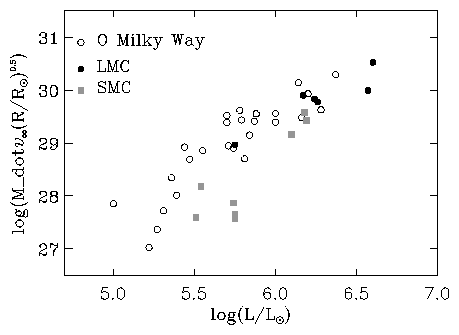
Figure 11 Wind momenta of O-stars in the Galaxy, LMC and SMC as a function of luminosity. Data from Puls et al (1996).
Although the number of objects studied in the Clouds is still small, it is clear that average momenta in the LMC
are smaller than in the Galaxy and average momenta in the SMC are smaller than in the LMC. Puls et al (1996) quote
a difference of 0.20 and 0.65 dex between the Galaxy and the LMC or SMC, respectively.
De Koter et al (1998) in their study of very massive stars in the compact cluster R136a in the LMC find very high wind momenta for their most luminous objects indicating a much steeper WLR than found by Puls et al (1996). This discrepancy is to a large extent the result of the different effective temperature determinations used. De Koter et al use the O v l 1371 line as a temperature indicator based on their model atmosphere calculations, whereas Puls et al used the optical He i l 4471 line. At the moment it is not clear which of the two methods is closer to the truth. Careful future spectroscopic work based on fully consistent hydrodynamic line-blanketed non-LTE models will be needed to clarify the situation.
Large observing programs of A- and B-supergiants in the Magellanic Clouds are presently under way to investigate the influence of metallicity at later spectral types. In addition, a large number of O-stars have been observed in both Clouds with HST very recently. These programs will allow to constrain the rôle of metallicity much more precisely.
As mentioned several times in the previous sections, the basic mechanism driving the winds of hot stars is the transfer of photospheric photon momentum to the stellar atmosphere plasma through absorption by spectral lines.
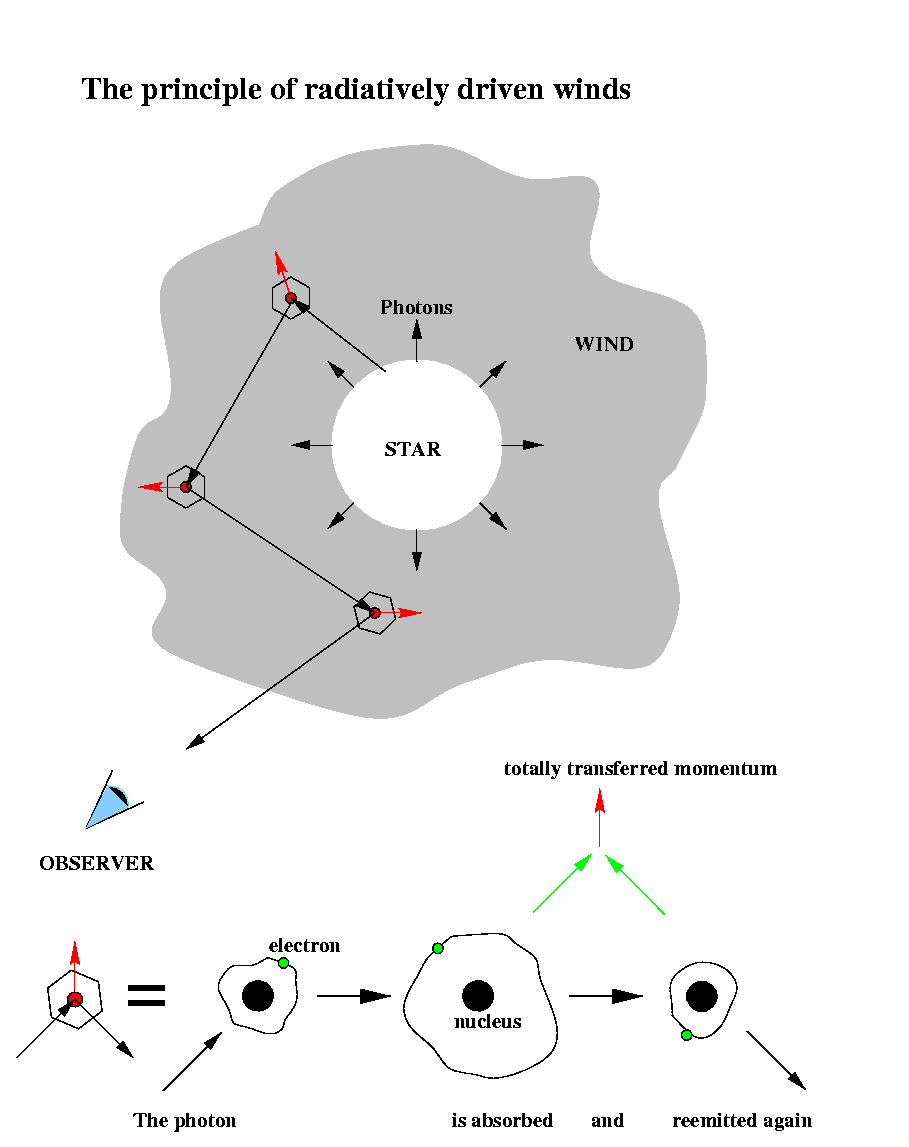
Obviously, the properties of stellar winds must depend on the number of lines being available to absorb significant amounts of photon momentum, in particular at wavelengths around the photospheric flux maximum. However, not only the number of lines is important; their ability to absorb, i.e., their optical thickness, is important too. In supersonically expanding winds optical thickness is a local quantity as described by Eqs. 4 and 5. Introducing the ``line-strength'' ki and the Thomson optical depth parameter t(r), the optical thickness ti of each line can be expressed as
|
(11) |
|
(12) |
|
(13) |
|
(14) |
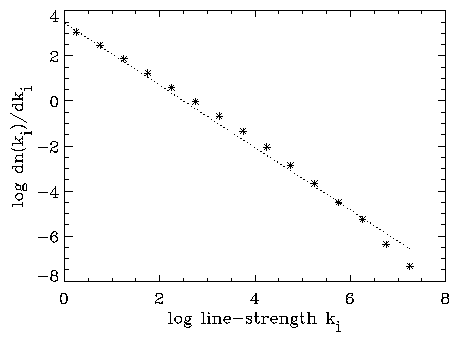
Logarithmic plot of the line-strength distribution function for a stellar wind model with Tef f = 40000 K. Dots are numbers from the line list in the model atmosphere code described by Springmann & Puls (1998) and Puls et al (1999b). The dashed curve is a power law fit for a = 0.62.
The local non-LTE ionization balance in a stellar wind depends on the ratio of electron density to the geometrically
diluted radiation field (see Sect. 2.4.1) and may change from the photosphere
to the outer layers of the stellar wind flow. In such a case we would also expect the line-strength distribution
function to change so that both a and Neff vary with height. Abbott
(1982) introduced a parameterization of this effect by adopting Neff = N0 (10-11
cm3 ne/W)d, with electron density
ne (in cgs units) and dilution factor W. This parameterization accounts only for
ionization changes in the normalization (Neff) of the line-strength distribution function, but
ignores possible simultaneous effects on its slope (a), which can become important under
certain conditions (see Kudritzki et al 1998, Puls et al 2000). Typical values of d
for O-stars are d ~ 0.05 to 0.1.
Solving the equation of motion for stationary, spherically symmetric line driven winds with line-strength distribution functions as described by Eqs 13, the d-term and corresponding radiative line accelerations (Eq. 14), one obtains for terminal velocity and the mass loss rate (see Kudritzki et al 1989)
|
(15) |
|
(16) |
|
(17) |
The mass-loss rate is influenced by both the effective number of lines N0 driving the wind, and the slope a¢, in particular, due to its dependence on the stellar luminosity. Unfortunately, Mdot depends also on the ``effective mass'' M*(1-G) which, for instance for O-stars and early B-supergiants, varies a lot from star to star and introduces a significant scatter, if one wants to correlate stellar mass-loss rates with luminosity.
The scatter is, however, reduced if one considers the ``modified stellar wind momentum'' as introduced by Eq. 10 and combines Eqs. 15, 16, 8 to obtain
|
(18) |
The slope of the observed WLR can be used to determine the value of a¢ empirically as a function of the spectral type through a¢ = 1/x. The corresponding values are given in Table 2 and indicate that a¢ decreases systematically with decreasing effective temperature. This conclusion is confirmed by applying Eq. 15 to the observed ratios v¥/vesc (see Eq. 9). Assuming d = 0.05 and vesc = 700, 350 and 200 km/s for O-stars, B-supergiants with Tef f £ 22000 K and A-supergiants, respectively, we obtain for a 0.60, 0.40 and 0.32, slightly lower than the values in Table 2 but indicating the same trend with Tef f (see also Lamers et al 1995 and Achmad et al 1997, who were the first to point out that the terminal velocities of A- and mid to late B-supergiants require low values of a).
The physical reason for the change in the slope of the line-strength distribution function with effective temperature is, of course, the change in ionization of the elements contributing to the radiative line acceleration. As shown in the detailed investigation by Puls et al (2000), changes of ionization affect the line-strength distribution function mostly at small and intermediate line-strengths. Here, the contribution of the iron group elements is crucial with their large number of meta-stable levels. With decreasing ionization the number of lines from iron group elements at small and intermediate line-strengths becomes larger and larger. On the other hand, the contribution to the line-strength distribution at large line-strengths results mostly from light ions, whose contribution remains rather constant as a function of temperature. As a result, the slope of the total line-strength distribution function over all line-strengths becomes steeper and a becomes smaller with decreasing effective temperature. Footnote: We note in passing that the power law fit of the line-strength distribution function with a constant exponent a is only a first order approximation. In reality, the function shows a distinct curvature which has to be considered in realistic stellar wind calculations (see Pauldrach et al 1994, Kudritzki et al 1998). The effect is, thus, understood qualitatively. A quantitative confirmation based on a detailed comparison at the low temperature end of non-LTE wind models with observations resulting from the spectroscopic analysis has still to be carried out (see, however, first results presented by Kudritzki 1999a,b).
The variation of the coefficient D0 of the WLR can be used to estimate empirically the effective number of lines N0 contributing to the stellar wind acceleration. This is, however, a more complex matter, since D0 depends on the flux weighted total number of spectral lines as well as on a¢ and a itself (Puls et al 2000). Only in cases of similar slopes a comparison gives direct insight into the absolute number of effectively driving lines, whereas in all other cases their distribution with respect to line-strength (a) has a significant influence on the offset.
Due to its (partial) dependence on flux-weighted line number, D0 varies between spectral types not only because of ionization changes but also because of the different spectral locations of the lines with regard to the flux maximum and absorption edges such as the hydrogen Lyman- and Balmer- edges. At least concerning the observed differences in D0 between O-type and A-type supergiants (accounting for the changes in a¢), D0 can be understood in terms of the theoretically predicted effective number of lines N0, as demonstrated by Puls et al (2000). However, to predict the full variation of D0 over the whole range of effective temperatures quantitatively and thus to check whether this interpretation is generally valid will require more detailed calculations of radiation driven wind models in the future. As expressed by Kudritzki et al (1999), especially the pronounced drop in D0 between effective temperatures of 23500 K and 22000 K (on the temperature scale of unblanketed models) is a challenge for the theory. A detailed spectroscopic study of a larger sample of objects in this transition range of temperatures to disentangle stellar wind properties in more detail will certainly be extremely valuable. In addition, a careful re-investigation whether systematic effects (for instance, deviations of the helium abundances from the normal value or metal line blanketing and blocking in this temperature range) may have influenced the results of the spectroscopic analysis will be important.
The theory of line driven winds makes also a clear prediction about the influence of metallicity on the strengths of stellar winds. The first order effect arises from the fact that the effective number of lines contributing to the line acceleration changes with metallicity e and, hence, causes a metallicity dependence of the mass-loss rate
|
(19) |
A second effect might be important for the metallicity dependence of terminal velocities as well as for the overall slope (x = 1/a¢) of the WLR, as discussed by Puls et al (2000). This effect results from the curvature of the line-strength distribution function, which has a steeper slope (smaller a) for the larger line-strengths which become important for the acceleration of winds at lower metallicity, where the winds are weaker and the corresponding optical thicknesses are smaller. However, as pointed out by Puls et al, there are several competing effects of comparable magnitude in the acceleration of the outer layers of winds such as differences in CNO abundance ratios or changes in ionization at different metallicity. It is, therefore, too early to make a clear theoretical prediction for all spectral types. The lower terminal velocities (as well as the indications of a steeper slope) observed for SMC O-stars, though, indicate that the theory is appropriate for O-stars.
The problem of thin winds. As we have seen (cf. Figure 8), the observed WLR for O-type dwarfs, if taken literally, exhibits a severe curvature towards (very) low wind-momenta at luminosities lower than logL/Lsun = 5.3. (Note, that the derived momenta are upper limits in this luminosity range.) As pointed out above, the two objects which fall below the relation are rapid rotators. Although this fact alone might initiate the deviations from the WLR (see the next subsection), there are three additional effects which are important for the physics of very thin winds from dwarfs (or in a low metallicity environment) and might induce a strong deviation from the usual WLR.
First, standard theory requires the photon momentum absorbed almost exclusively by metal ions to be transferred to the bulk of the wind plasma (hydrogen and helium) via Coulomb-collision. A detailed investigation by Springmann & Pauldrach (1992) illuminated the limits of this process: For thin winds, the metal ions can decouple from the rest of the plasma, and the wind does no longer reach the same terminal velocity which would follow in the standard picture. Using a multifluid approach (including the various Coulomb-collisions as function of plasma parameters), Babel (1995) presented a model for inhomogeneous radiatively driven winds of A-dwarfs, where the resulting Mdot turned out to be very low. Second, the inclusion of shadowing by photospheric lines (not considered in the usual computation of the line-force) has large consequences for the wind of B-dwarfs, resulting again in mass-loss rates well below the standard results (Babel 1996). Finally, as shown by Puls et al (1998) and Owocki & Puls (1999), curvature terms of the velocity field in the transonic region can lead to line-accelerations much smaller than in the standard computations, leading to reduced mass-loss rates. This process, however, is only effective when the continuum is optically thin throughout the transonic region, i.e., , can be present only in thin winds. Together, these results imply that low-luminosity dwarfs are subject to a number of processes reducing the mass-loss rate compared to the scaling relations above. The position of the turn-over point as function of various stellar parameters (incl. metallicity), however, remains still to be defined.
So far, all our discussion neglected the influence of rotation on the wind-structure itself, which shall be discussed in the following. Footnote: For the effects of rotation on stellar evolution/structure see Langer & Heger (1998), Maeder (1998, 1999) and Meynet (1998). Recent reviews on this topic have been given by Owocki et al (1998a, b), Bjorkman (1999) and Puls et al (1999a).
The major aspect which has to be accounted for in addition to the ``conventional'' approach is, at least on a first glance, the impact of centrifugal acceleration as function of radius r and co-latitude q. It has been studied first by Friend & Abbott (1986) and Pauldrach et al (1986) in its most simple way, considering only particles in the equatorial plane. With the assumption of a purely radial line acceleration, the angular momentum remains conserved (only central forces present), and the rotational speed is given by vf(r) = vrot(R*,q = p/2)/r. Thus, the usual equation of motion is modified by the centrifugal acceleration only, which leads to an effective gravity of G M (1-G)/(R*r)2 (1-W2 /r), where W is the ratio of rotational speed at the (equatorial) surface vrot(R*) to the break-up velocity vbreak = vesc/ Ö2, with vesc the photospheric escape velocity defined in Eq. 8. Thus, the only difference to non-rotating models is the modification of effective mass by roughly a factor of (1 - W2):
|
(20) |
Of course, the above scaling laws are valid only in the equatorial plane and can be considered as sort of a maximum effect. Accounting also for the variation of vf as function of q, Bjorkman & Cassinelli (1993) elaborated the concept of so-called ``wind-compressed'' disks and zones.
The basic idea follows again from the assumption of purely radial line forces. Thus, the specific angular momentum is actually conserved for all particles, and their motion is restricted to the orbital plane to which they belong (tilted by an angle of co-latitude qo from which they start). Neglecting pressure forces in the supersonic region, the free flow of the particles can be simulated then by a corresponding 1-D treatment as above, with modified rotational rate Wsinqo. Consequently, mass-loss rates and velocities in the orbital plane follow the same scaling relations as above, however with W2 replaced by W2sin2 qo. In the course of the particles' motion, their azimuthal angle F¢(r) in the orbital plane is increasing, and they are deflected towards the equator. If the ratio of vrot/v¥ is significant and/or the radial velocity field in the lower wind region is flat, F¢ might become ³ p/2, and the particles would cross the equator. Here, they collide supersonically with particles from the other hemisphere, and a wind compressed disk (WCD) is formed. In those cases where the particles do not collide (F¢(r ®¥) < p/2), at least a wind compressed zone (WCZ) is created, i.e., an anisotropic wind with highest densities at the equator.
The hydrodynamical stratification in stellar coordinates is obtained by following the particles' streamlines. For non-colliding winds with not too large deflection angle F¢ or generally close to the star (q » qo), one finds
|
(21) |
It is important to realize that the outlined results rely exclusively on the assumption of purely radially directed line forces. As turned out by a detailed investigation of the other (vector-)components (cf. Owocki et al 1996), particularly the polar one cannot be neglected in the delicate balance of forces. Footnote: Concerning the azimuthal component affecting the angular momentum and allowing for a spin-down of the wind, cf. Grinin (1978) and Owocki et al (1998a). As long as the radial velocity law at the equator is slower than in polar regions - an almost inevitable consequence of rotation due to the reduced escape velocity at the equator - a polewards acceleration is created which is sufficient to stop the equatorwards motion predicted by WCD/WCZ-models and actually reverses its direction, an effect named ``inhibition effect'': disks can no longer be formed. Together with the distortion of the stellar surface by centrifugal forces (e.g., Cranmer & Owocki 1995) and the well-known von Zeipel theorem (surface flux scaling with effective gravity as function of q, cf. Maeder 1998, 1999 for recent improvements), the original scaling of Mdot (Eq. 21) can be actually reversed, i.e., the inclusion of gravity darkening (increased polar radiation flux) might lead to a larger polar mass-flux
|
(22) |
Radiation driven wind models for a fast rotating B-star, using different assumptions
|
|
1. Purely radial line force: Wind compressed disk |
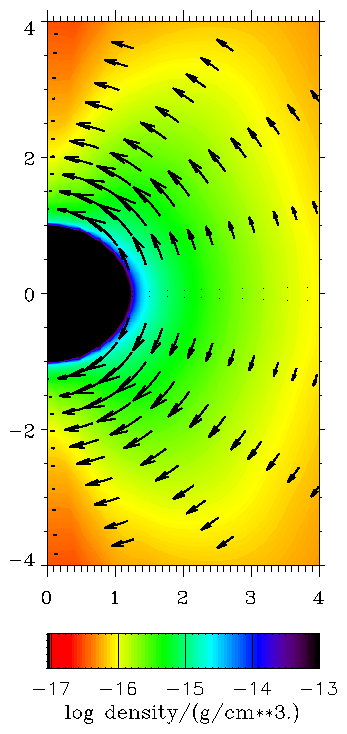 |
2. Non-radial line force, uniform brightness temperature: The inhibition effect |
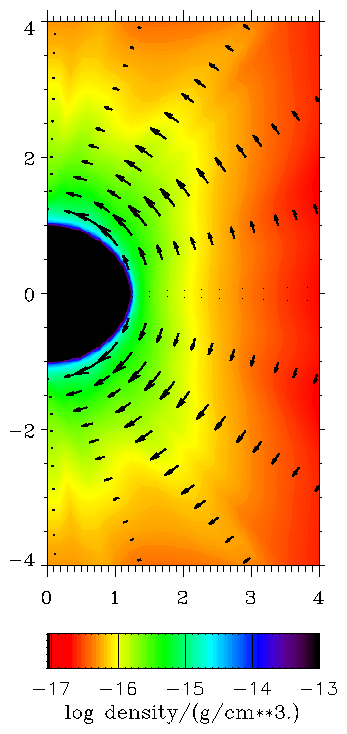 |
3. Non-radial line force + gravity darkening: Prolate wind structure |
Recent work by Petrenz (1999) concentrated on a consistent description of hydrodynamics and statistical equilibrium (controlling the line-force), in order to clarify in how far the 2-D stratification of occupation numbers is of importance and might have an influence on the final result. A number of models with various kinds of differing approximations have been calculated, confirming however all basic trends quoted above.
Thus, the present status of modeling rotating stellar winds can be summarized as follows: If one neglects the non-radial components of the line-force, an oblate wind-structure is created, with meridional velocities directed towards the equator. For large values of W, a wind-compressed disk might show up. Accounting additionally for non-radial line-forces, the resulting polewards acceleration reverts the direction of the meridional velocity field and ``inhibits'' the disk formation. Finally, the inclusion of gravity darkening allows even for a prolate wind structure.
In view of these different scenarios (for additional processes which might be relevant, cf. Bjorkman 1999) and with respect to our discussion of the WLR, it is especially interesting to investigate the dependence of wind-momentum on rotation. From the simplified approach (Eq. 21) and for a¢ = 2/3, the wind momentum rate becomes independent of angle, i.e., , Mdotv¥(W, q) » Mdotv¥(W = 0), since, as in the corresponding 1-D models, the dependence on effective mass completely cancels out. Numerical simulations (radial forces only) verify this prediction with high accuracy (Petrenz, priv. comm.). The maximum influence, on the other hand and discarding disks, is obtained for models with non-radial forces and gravity darkening. For rather large values of vrot = 250¼350 km/s, the wind-momentum rate varies typically by a factor of two (pole) to 0.5 (equator), compared to 1-D, non-rotating models. Since Mdot and v¥ depend on W2, the effect of ``normal'' rotational rates, however, becomes minor with respect to other uncertainties. Note especially, that all theoretical results derived so far unfortunately lack direct observational proof.
There exists another class of massive objects where rotation might be even more important, the B[e]-supergiants with a well-determined bimodal structure (slow and dense equatorial wind and fast, thin polar wind; for a recent review, see Zickgraf 1999). As has been shown by Pauldrach & Puls (1990) and investigated in detail by Vink et al (1999), continuum optical depth effects in the B-supergiant domain can induce the so-called ``bi-stability'' mechanism. The decisive quantity which controls this behaviour is the optical depth in the Lyman continuum, which - for rotating stars and accounting for gravity darkening - depends sensitively on rotationally induced variations of wind density and radiation temperature and thus becomes a strongly varying function of q (Lamers & Pauldrach 1991, Lamers et al 1999b; see however also Owocki et al 1998a). Due to this behaviour, the bi-stability effect is thought to be responsible for the B[e] phenomenon (Lamers & Pauldrach 1991) if the star rotates close to break-up and has a rather large average mass-loss. First hydrodynamical simulations (Petrenz 1999; Lamers, priv. comm) indicate that this hypothesis might actually work.
The basic philosophy underlying the previous results and conclusions has been outlined in Sect. 2.2 and comprises the assumption of a globally stationary wind (1-D or 2-D) with a smooth density/velocity stratification. However, as follows directly from the assumption of stationarity, these models are inherently incapable of describing a number of observational features (partly referred to in Sect. 2.4), which immediately show that nonstationary aspects of the wind must be important. Moreover, theoretical considerations based on a detailed investigation of the wind-driving agent, radiative line acceleration, show clearly that this acceleration is subject to a strong instability, which, when ``allowed'' to operate in time-dependent models, causes a variable and strongly structured wind hardly resembling the stationary and smooth model underlying our philosophy, at least at first glance. This section outlines the status quo with respect to observations and theory and some further implications.
In our review of diagnostic methods to derive global wind parameters (Sect. 2.4) we have met a number of issues that are difficult to reconcile with the stationary/smooth picture of winds. The following enumeration summarizes the most important observational findings concerning structure and temporal variability (including those already mentioned); for further details we refer to the proceedings cited at the end of Sect. 2.2.
Theoretical efforts to understand the nature and origin of these observational findings have generally focused on the line-driving mechanism itself. Linear stability analyses on the basis of a non-Sobolev description (see below) have shown the line-force to be highly unstable (MacGregor et al 1979, Carlberg 1980, Abbott 1980, Lucy 1984, Owocki & Rybicki 1984, 1985), with inward-propagating waves being more stronger amplified than outward-propagating ones.
Initial heuristic models by Lucy & White (1980) and Lucy (1982a) assumed that the resulting wind structure would consist of a periodic train of forward shocks. With some adjustment of parameters, this model reproduced the observed flux of soft X-rays (Lucy 1982b), though not the hard X-ray tail (Cassinelli & Swank 1983). Lucy (1982a, 1983) further showed that the multiply non-monotonic nature of the resulting velocity field could explain the black absorption troughs observed in saturated UV resonance lines (cf. Sect. 2.4.1).
Subsequent efforts have focused on dynamical modeling of the time-dependent wind structure from direct, numerical simulation of the non-linear evolution of the line-driven flow instability (for reviews see Owocki 1992, Owocki 1994 and Feldmeier 1999). The key aspect regards the computation of the force itself, since for unstable flows with structure at scales near or below the Sobolev length (Sect. 2.4.1) a local approach as given by the Sobolev treatment inevitably fails unless very refined precautions are taken (Feldmeier 1998). Instead, one must apply complex, computationally expensive integral forms that take into account the non-local character of radiation transfer. Owocki & Puls (1996, 1999) have discussed various levels of approximations which both account for the key-effects and are computationally feasible.
The most important finding of already the first simulations by Owocki et al (1988) was that the non-linear evolution leads to strong reverse shocks, a robust result that follows directly from the much stronger amplification of inward-propagating waves (see above). So-called ``smooth source function'' models (Owocki 1991) based on a simple approximation to incorporate the potentially stabilizing effect of the ``line-drag'' by the diffuse, scattered radiation field (Lucy 1984; Owocki & Rybicki 1985) have proven to be significantly more stable than the first models based on pure absorption, particularly in the lower wind. The outer wind, however, still develops extensive structure that consists, as before, of strong reverse shocks separating slower, dense shells from high-speed rarefied regions in between: only a very small fraction of material is accelerated to high-speed and then shocked; for most of the matter the major effect is a compression into narrow, dense ``clumps'' (shells in these 1-D models), separated by large regions of much lower density (cf. Figure below).
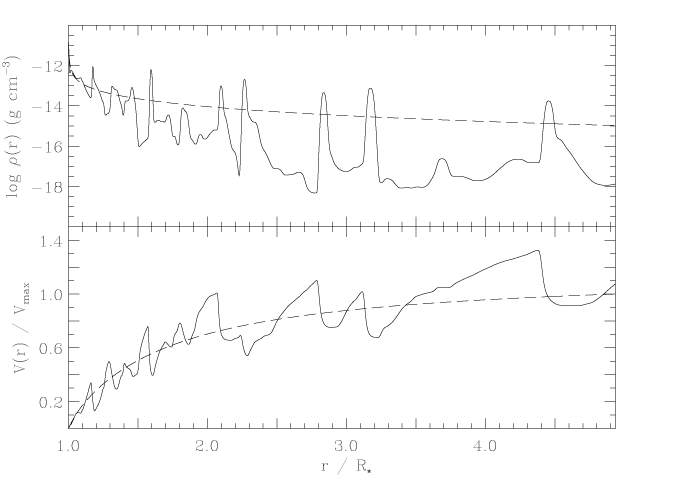
Density and velocity distribution vs. radius in a dynamical structured wind model (using the smooth source function approximation) at a fixed snapshot time some 60000 s after an initial condition given by a consistent stationary wind-model (dashed curves). The oscillations result from line-driven instability amplification of sound waves introduced at the wind base with a relative amplitude in density of 25 % and a period of 10000s. Calculations by S. Owocki. From Puls et al. (1993a).
Feldmeier (1995) extended these models by relaxing the assumption of isothermality, accounting for the energy transport
including radiative cooling. By investigating the influence of various photospheric disturbances which induce the
on-set of structure formation (via exciting the line-force instability) Feldmeier et al (1997b) concluded that
cloud-cloud collisions (and not the cooling of the reverse shocks themselves, e.g. Cooper & Owocki 1992) are
the actual reason for the observed X-ray emission (cf. Sect. 2.4.5).
Present effort concentrates on 2/3-D simulations of winds in order to clarify the effects of rotation (cf. Sect. 4.2) as well as the rôle of the line-instability with respect to CIR-models (Sect. 5.1). Owocki (1999) has given some impressive, however preliminary results of first simulations, which indicate that the small-scale, intrinsic line-instability can completely disrupt any kind of large-scale structure if it becomes too strong, as seems to be the case for the present model generation.
Obviously, time-dependent models based on a non-local line-force provide a satisfying explanation for a large number of observational findings. The results with respect to X-ray emission are most promising, and the presence of shocks allows also to construct a consistent description of non-thermal radio emission in winds from single stars. Since the latter scenario requires shocks that have survived until large radii, it seems at least plausible that only a fraction of massive stars are seen as non-thermal emitters (cf. the according discussion by Chen & White 1994).
One the other hand and at first glance, these models appear to be in strong contrast with our assumptions for the standard model for wind diagnostics based on stationarity and homogeneity, especially when viewed with respect to the spatial variation of velocity and density. However, when viewed with respect to the mass distribution of these quantities, the models are not so very different (Owocki et al 1988, Owocki 1992, Puls et al 1993a). Furthermore, the gross wind properties like the terminal flow speed and time-averaged mass loss rate turn out to be in quite good agreement with those following from a stationary approach (despite the problem of (very) thin winds, cf. Sect. 4).
Given the intrinsic mass-weighting of spectral formation (at least for resonance lines with constant ionization fraction) and the extensive temporal and spatial averaging involved, the observational properties of such structured models may be quite similar to what is derived from the ``conventional'' diagnostics, in an average sense. In detailed line-formation calculations assuming line-opacities proportional to the local density, Puls et al (1993a, 1994) and Owocki (1994) showed that this conjecture is actually justified, and they were able to demonstrate that unstable winds are excellent candidates to explain the observed black troughs.
In summary, such models seem able to offer the possibility of retaining the successes of stationary models in matching time-averaged observational properties, while also reproducing the spectral signatures (X-rays, non-thermal radio emission, black troughs, first hints on the nature of DACs and modulation features) suggesting the existence of extensive wind structure.
However, as should be clear from Sect. 2.4, only part of the described diagnostic methods relies on features coupled to processes with opacities µ r. The determination of Mdot (and b), depends on opacities/emissivities µ r2, regardless of whether it is determined via Ha , IR-excess, radio-fluxes or Si IV resonance lines (footnote: In so far, the calibration of mean ionization fractions of Si IV to radio and Ha mass-loss rates (Sect. 2.4.1) is intrinsically consistent!), so that the assumption of a stationary wind without clumping seems questionable in view of the perspectives outlined above.
Let us first concentrate on the results derived from Ha , the primary diagnostic tool also for extragalactic work. At least for the majority of OB-stars, the corresponding wind emission comes from lower wind layers, typically between 1.0 and 1.5 stellar radii. Hydrodynamical simulations of self-excited wind instabilities show that these layers seem to be unaffected by shocks and that instabilities only occur further out in the wind (Owocki 1994). This agrees with the fact that the observed X-rays most probably are emitted in the outer layers (Hillier et al. 1993) and that the black troughs considered above can arise also from small-scale structures present only in the outer wind (also Owocki 1994).
Nevertheless, instabilities producing a small density contrast might still be present in the Ha forming region, if the wind is triggered by photospheric perturbations (sound waves, (non-)radial pulsations), in accordance with observational findings that disturbances (however of low amplitude) are seen throughout the wind (Sect. 5.1). In such cases the location of the onset of structure formation depends crucially on the damping by the diffuse radiation force. Recent hydrodynamical simulations including photospheric perturbations (Feldmeier et al 1997b) show pronounced inhomogeneous structures only above 1.3 R*, and even in the most elaborate models including the effects of disturbances in the diffuse radiation field (Owocki & Puls 1999), the same result is found. Thus it seems probable that the neglect of clumping does not induce large systematic errors for OB-star mass-loss determinations. For A-supergiants, the situation remains unclear, since hydrodynamical simulations in the corresponding parameter space have not been performed yet, and since the lines are formed all the way out to larger radii. Footnote: Note, that at least for WR-winds clumping seems to be decisive, since the analysis of the mass spectrum of the observed blobs implies a factor three overestimate in the mass-loss derived from IR and radio observations (Moffat & Robert 1994), in rough agreement with the results from detailed line fits based on clumped wind models referred to in Sect. 5.1.
A second line of reasoning in favor of our assumption was given by Lamers & Leitherer (1993) and Puls et al (1993b). Briefly, they argued that because of the same r2 dependence of both the radio and the Ha emission and the fact that both rates agree for those objects with Ha and radio mass-loss rates, this would imply the same clumping factor in regions close to (Ha ) and far away from the star (radio). As this is rather unlikely, since in the lower wind the formation of structure just sets in, whereas in the outer part any structure should have stabilized, it is most probable that the degree of clumping in the lower wind part is small, if present at all. A scenario consistent with all observational facts has been described by Feldmeier et al (1997b), based on a simulation extended to 100 stellar radii: The lower wind remains rather smooth (damping of the instability), the intermediate part is clumpy (line force instability ``at work''), and the outermost part (above 10 R*) is rather smooth again, related directly and indirectly to inefficient radiative cooling in this region. Note, however, that a few strong shocks actually survived up to large radii in this model, just as required to produce non-thermal radio emission.
As a consequence of this scenario, one would expect erroneous mass-loss rates only from diagnostics of the intermediate wind part, in accordance with the findings of an inconsistency of IR-excess and radio mass-loss rate from a few stars described by Runacres & Blomme (1996) and the discrepancy for the mass-loss rate of HD 53138 discussed in Sect. 2.4.4.
If, in contrast, one were to assume the worst case of significant structure everywhere in the wind, this would imply that all present results from refined NLTE diagnostics (Sect. 2.2) are just a by chance product and unreliable. However, since the detailed NLTE calculations for smooth winds agree very well with observed spectra for a variety of ions with different dependences on r and since significant structure everywhere in the wind would certainly disturb the ionization balance severely, this implication seems rather improbable.
Even if this were the case, however, the method to use the WLR of hot stars as an extragalactic distance indicator (see Sect. 6) would work, because of the empirical calibration with stars at known distances as function of spectral type and metallicity. On the other hand, all global quantities (Sect. 2.1) involving the mass-loss rate (linearly) would then have to be reduced by the square root of the effective clumping factor.
Stellar winds with their broad and easily detectable spectral features distributed over the whole wavelength range from the UV to the IR are a gift of nature. With the new ground-based telescopes of the 8m to 10m class, stellar wind lines can be easily identified in medium resolution spectra of blue supergiants individually observable out to distances of 20 Mpc (Kudritzki 2000) or in the integrated spectra of starburst regions in galaxies even much more distant out to redshifts of z ~ 4 (Steidel et al 1996). Using the know-how obtained from the investigation of winds in the galaxies of our Local Group these stellar wind features can provide unique information about young stellar populations, chemical composition, galactic evolution and extragalactic distances.
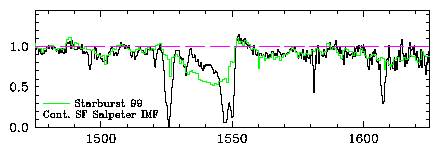
Figure 12 Comparison between the observed rest-frame spectrum of the starburst galaxy cB58 (black histogram) at redshift z = 2.72 in the region of the C IV l 1549 stellar wind line with a spectral synthesis model, assuming continuous star formation and a Salpeter IMF. Note that the population synthesis code applied uses a library of observed spectra of galactic stars with abundances corresponding to the galactic disk at the solar neighbourhood (see Leitherer et al, 1999). From Pettini et al (1999).
Figure 12 shows the observed spectrum of the gravitationally lensed, highly redshifted
starburst galaxy cB58 around the wavelength of the C iv resonance line revealing a typical stellar wind P Cygni
profile blended by interstellar lines. As demonstrated by Pettini et al (1999) this line feature can be used to
constrain the star formation process and metallicity. The authors conclude from the strength of the C iv feature
that the metallicity must be smaller than solar. This conclusion is confirmed by the work of Walborn et al (1995)
and Haser et al (1998), which indicates that metallicity has a substantial influence on the morphology of stellar
wind lines (cf. Figure below)
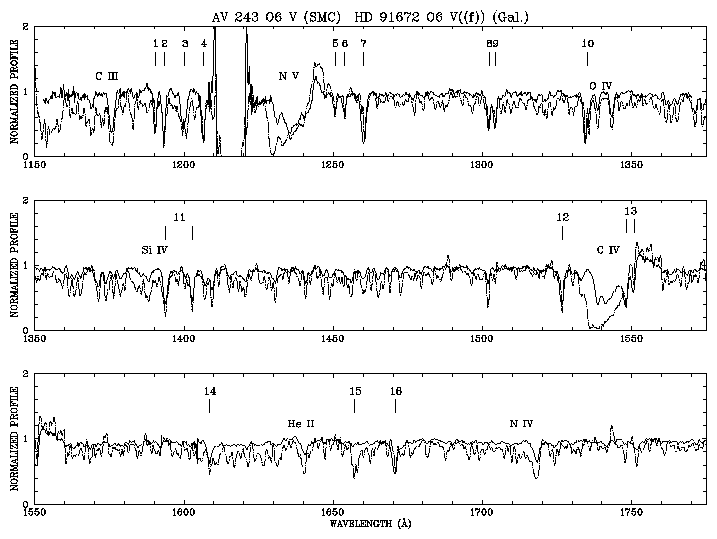
Comparison of the UV spectra of two individual O6 V stars in the Galaxy and the SMC, HD 91672 (Galaxy, dashed-dotted) and AV 243 (SMC, solid). Note the significant difference in the strengths of pseudophotospheric lines of iron group elements and the difference in the stellar wind lines. The important effect of metallicity on spectral population synthesis is obvious. Vertical bars with numbers indicate interstellar lines. From Kudritzki (1998).
Figure 13 shows the ``modified'' stellar wind momenta of A-supergiants in the galaxy
and M31 as a function of absolute magnitude. As demonstrated by Kudritzki et al (1999) such a relationship can
be used to determine extragalactic distances with an accuracy of about 0.1 mag in distance modulus out to the Virgo
and Fornax clusters of galaxies. A-supergiants as the optically brightest ``normal stars'' with absolute magnitudes
between -9 and -8 are ideal for this purpose. Their wind momenta can be determined solely by optical spectroscopy
at Ha . The quantitative analysis of the rest of the optical spectrum
will yield effective temperature, gravity, chemical composition and - in conjunction with accurate photometry -
reddening and extinction so that an application of the wind momentum - luminosity relationship, properly calibrated
as a function of metallicity in Local Group galaxies, will finally yield accurate distances.
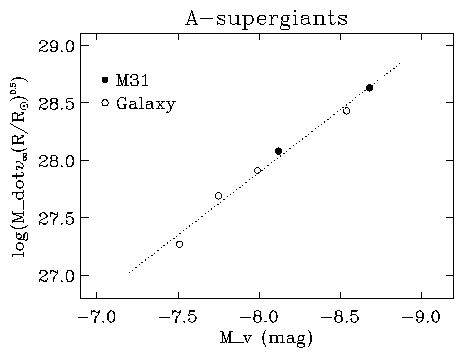
Figure 13 Wind momenta of galactic and M31 A-supergiants as a function of absolute
visual magnitude. The data of the M31 objects are adapted from McCarthy et al (1997), however accounting for new
data, mostly with respect to photometry. The dashed curve is the linear regression obtained from all objects.